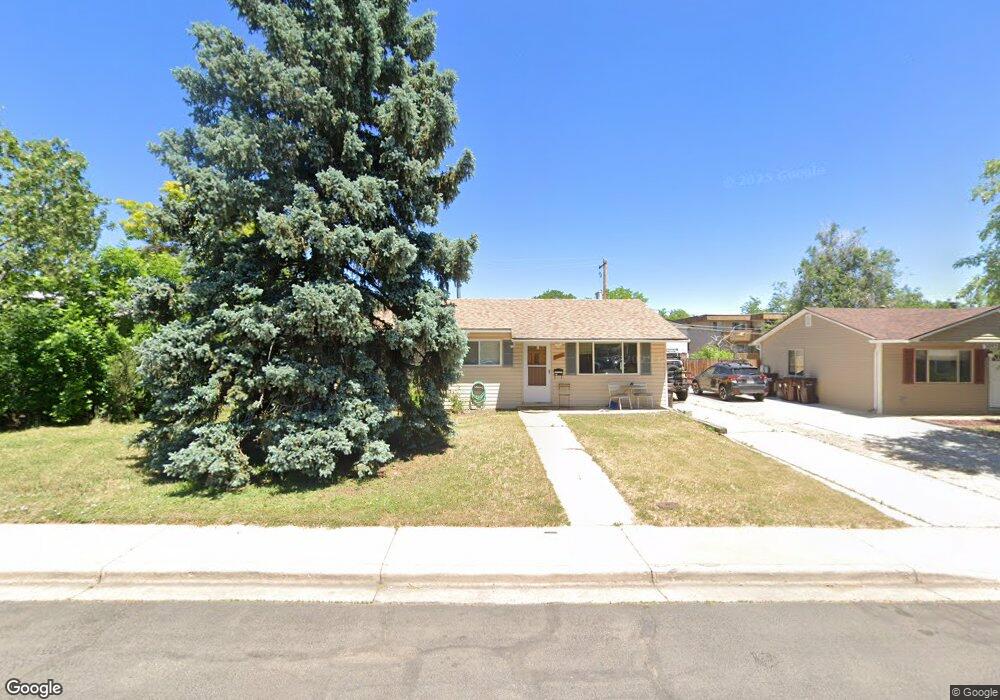
3065 Euclid Ave Boulder, CO 80303
East Aurora NeighborhoodEstimated Value: $667,000 - $736,000
3
Beds
2
Baths
1,056
Sq Ft
$655/Sq Ft
Est. Value
About This Home
This home is located at 3065 Euclid Ave, Boulder, CO 80303 and is currently estimated at $692,147, approximately $655 per square foot. 3065 Euclid Ave is a home located in Boulder County with nearby schools including Creekside Elementary School, Manhattan Middle School of the Arts & Academics, and Fairview High School.
Ownership History
Date
Name
Owned For
Owner Type
Purchase Details
Closed on
Aug 20, 2008
Sold by
Hartenstein Hugo and Hartenstein Olivia L
Bought by
Hartenstein Hugo
Current Estimated Value
Purchase Details
Closed on
Feb 28, 1995
Sold by
Miller Dave
Bought by
Hartenstein Hugo
Home Financials for this Owner
Home Financials are based on the most recent Mortgage that was taken out on this home.
Original Mortgage
$97,500
Interest Rate
9%
Purchase Details
Closed on
Sep 4, 1990
Bought by
Hartenstein Olivia L and Hartenstein Hugo
Purchase Details
Closed on
Dec 2, 1985
Bought by
Hartenstein Olivia L and Hartenstein Hugo
Purchase Details
Closed on
Jul 7, 1978
Bought by
Hartenstein Olivia L and Hartenstein Hugo
Create a Home Valuation Report for This Property
The Home Valuation Report is an in-depth analysis detailing your home's value as well as a comparison with similar homes in the area
Home Values in the Area
Average Home Value in this Area
Purchase History
| Date | Buyer | Sale Price | Title Company |
|---|---|---|---|
| Hartenstein Hugo | -- | None Available | |
| Hartenstein Hugo | $130,000 | Commonwealth Land Title | |
| Hartenstein Olivia L | $68,500 | -- | |
| Hartenstein Olivia L | $69,000 | -- | |
| Hartenstein Olivia L | -- | -- |
Source: Public Records
Mortgage History
| Date | Status | Borrower | Loan Amount |
|---|---|---|---|
| Previous Owner | Hartenstein Hugo | $97,500 |
Source: Public Records
Tax History Compared to Growth
Tax History
| Year | Tax Paid | Tax Assessment Tax Assessment Total Assessment is a certain percentage of the fair market value that is determined by local assessors to be the total taxable value of land and additions on the property. | Land | Improvement |
|---|---|---|---|---|
| 2025 | $4,245 | $43,119 | $26,456 | $16,663 |
| 2024 | $4,245 | $43,119 | $26,456 | $16,663 |
| 2023 | $4,169 | $47,409 | $34,324 | $16,770 |
| 2022 | $3,376 | $35,549 | $24,902 | $10,647 |
| 2021 | $3,223 | $36,572 | $25,618 | $10,954 |
| 2020 | $3,368 | $38,696 | $23,524 | $15,172 |
| 2019 | $3,317 | $38,696 | $23,524 | $15,172 |
| 2018 | $3,043 | $35,100 | $22,104 | $12,996 |
| 2017 | $2,948 | $38,805 | $24,437 | $14,368 |
| 2016 | $2,625 | $30,320 | $17,990 | $12,330 |
| 2015 | $2,485 | $23,856 | $8,915 | $14,941 |
| 2014 | $2,006 | $23,856 | $8,915 | $14,941 |
Source: Public Records
Map
Nearby Homes
- 3009 Madison Ave Unit M-315
- 3000 Colorado Ave Unit F122
- 3000 Colorado Ave Unit D114
- 3000 Colorado Ave Unit 122F
- 3000 Colorado Ave Unit B206
- 905 36th St
- 2850 E College Ave Unit 110
- 2850 E College Ave Unit 301
- 805 29th St Unit 253
- 805 29th St Unit 504
- 2960 Shadow Creek Dr Unit 101
- 2902 Shadow Creek Dr Unit 204
- 2801 Pennsylvania Ave Unit 203
- 2865 Sundown Ln Unit 108
- 2802 Sundown Ln Unit 102
- 2800 Sundown Ln Unit 109
- 880 Gilpin Dr
- 2877 Moorhead Ave
- 385 32nd St
- 340 29th St
- 3095 E Euclid Ave
- 3035 Euclid Ave
- 3095 Euclid Ave
- 3040 Madison Ave
- 3050 Madison Ave
- 3105 Euclid Ave
- 3005 Euclid Ave
- 1090 30th St
- 1090 30th St
- 1090 30th St Unit 3
- 1090 30th St Unit 2
- 3050 Euclid Ave
- 3100 Euclid Ave
- 3135 Euclid Ave
- 3100 Madison Ave
- 3100 Madison Ave
- 3000 Euclid Ave
- 3130 Euclid Ave
- 3165 E Euclid Ave
- 3165 Euclid Ave