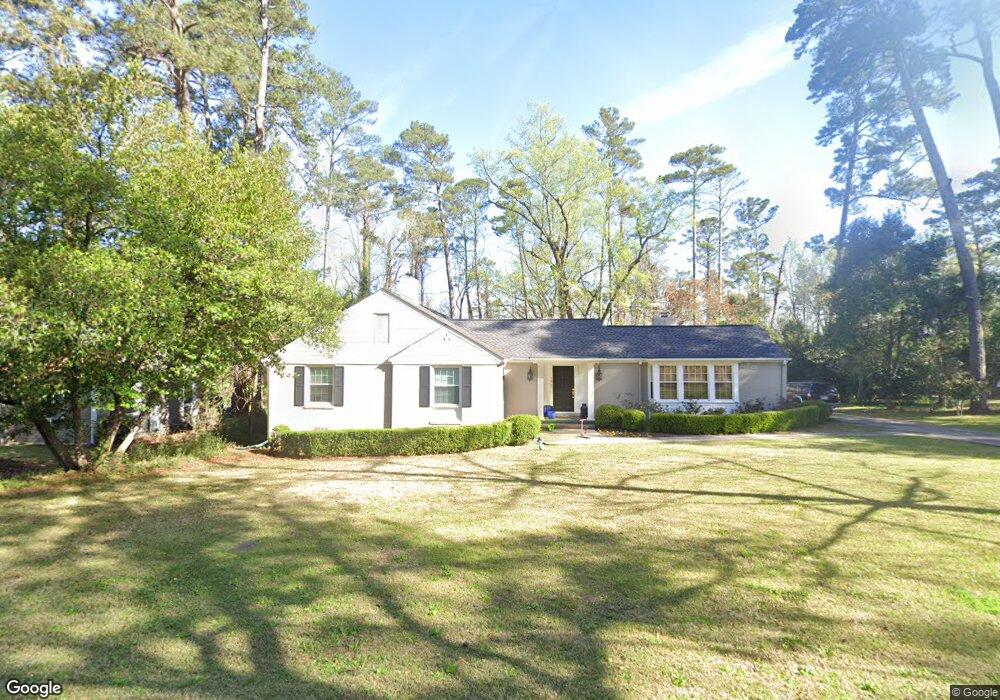
3065 High Point Dr Macon, GA 31204
Ingleside Historic District NeighborhoodEstimated Value: $287,000 - $538,000
4
Beds
4
Baths
2,555
Sq Ft
$146/Sq Ft
Est. Value
About This Home
This home is located at 3065 High Point Dr, Macon, GA 31204 and is currently estimated at $372,808, approximately $145 per square foot. 3065 High Point Dr is a home located in Bibb County with nearby schools including Rosa Taylor Elementary School, Miller Fine Arts Magnet Middle School, and Central High School.
Ownership History
Date
Name
Owned For
Owner Type
Purchase Details
Closed on
Jan 8, 2018
Sold by
Davis Grant H
Bought by
Harris Caroline Wallace Mcleod and Harris Marlin Jefferson
Current Estimated Value
Home Financials for this Owner
Home Financials are based on the most recent Mortgage that was taken out on this home.
Original Mortgage
$270,000
Interest Rate
3.92%
Mortgage Type
Unknown
Purchase Details
Closed on
Sep 12, 2016
Sold by
Blythe M
Bought by
Davis Grant H
Home Financials for this Owner
Home Financials are based on the most recent Mortgage that was taken out on this home.
Original Mortgage
$195,300
Interest Rate
3.45%
Mortgage Type
New Conventional
Purchase Details
Closed on
Jan 15, 2011
Sold by
Grice Benning M Jr Blalock Ann and Grice Benning M Jr Grice
Bought by
Hamilton Blythe M
Purchase Details
Closed on
Aug 15, 2007
Sold by
Hamilton Edward E
Bought by
Hamilton Blythe M
Create a Home Valuation Report for This Property
The Home Valuation Report is an in-depth analysis detailing your home's value as well as a comparison with similar homes in the area
Home Values in the Area
Average Home Value in this Area
Purchase History
| Date | Buyer | Sale Price | Title Company |
|---|---|---|---|
| Harris Caroline Wallace Mcleod | -- | None Available | |
| Davis Grant H | $217,000 | -- | |
| Hamilton Blythe M | -- | -- | |
| Hamilton Blythe M | -- | None Available |
Source: Public Records
Mortgage History
| Date | Status | Borrower | Loan Amount |
|---|---|---|---|
| Closed | Harris Caroline Wallace Mcleod | $270,000 | |
| Previous Owner | Davis Grant H | $195,300 |
Source: Public Records
Tax History Compared to Growth
Tax History
| Year | Tax Paid | Tax Assessment Tax Assessment Total Assessment is a certain percentage of the fair market value that is determined by local assessors to be the total taxable value of land and additions on the property. | Land | Improvement |
|---|---|---|---|---|
| 2025 | $2,295 | $100,409 | $23,088 | $77,321 |
| 2024 | $1,981 | $85,016 | $17,760 | $67,256 |
| 2023 | $1,524 | $85,016 | $17,760 | $67,256 |
| 2022 | $2,751 | $86,458 | $10,414 | $76,044 |
| 2021 | $3,004 | $86,053 | $10,009 | $76,044 |
| 2020 | $3,069 | $86,053 | $10,009 | $76,044 |
| 2019 | $3,095 | $86,053 | $10,009 | $76,044 |
| 2018 | $5,297 | $85,352 | $10,414 | $74,938 |
| 2017 | $2,959 | $85,981 | $11,043 | $74,938 |
| 2016 | $2,416 | $76,830 | $11,043 | $65,787 |
| 2015 | $3,861 | $85,827 | $18,364 | $67,464 |
| 2014 | $4,463 | $85,317 | $18,364 | $66,954 |
Source: Public Records
Map
Nearby Homes
- 509 Sugarloaf Dr
- 2783 S Hillandale Cir
- 3175 Stinsonville Rd
- 3105 Ingleside Ave
- 3341 Stinsonville Rd
- 3280 Ingleside Ave
- 2727 Ingleside Ave
- 2939 General Lee Rd
- 2659 Gwinnett Dr
- 3341 Ridge Ave
- 250 Crumps Park Ave
- 2925 Malvern Hill Dr
- 2749 Northwoods Dr S
- 2956 Malvern Hill Dr
- 630 Pierce Ave
- 2576 Old Holton Rd
- 2724 Ingleside Ave
- 676 Pierce Ave
- 2526 Old Holton Rd
- 3065 Highpoint Dr
- 3077 Highpoint Dr
- 3077 High Point Dr
- 3089 Highpoint Dr
- 595 Emily Place
- 3003 Highpoint Dr
- 3003 High Point Dr
- 3105 High Point Dr
- 3010 High Point Dr
- 575 Emily Place
- 3010 Highpoint Dr
- 3113 High Point Dr
- 3116 High Point Dr
- 565 Emily Place
- 594 Emily Place
- 3121 Highpoint Dr
- 3121 High Point Dr
- 2975 N Hillandale Cir
- 2975 N Hillandale Cir Unit 2
- 582 Emily Place