Estimated Value: $1,563,000 - $2,624,000
4
Beds
3
Baths
4,000
Sq Ft
$535/Sq Ft
Est. Value
About This Home
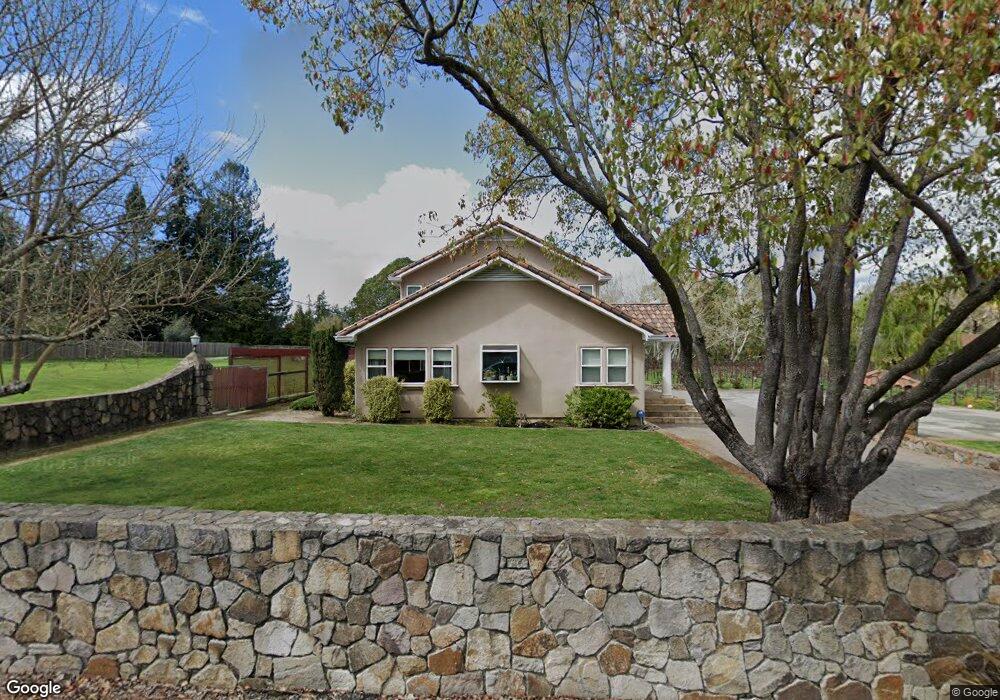
This home is located at 3065 Vichy Ave, Napa, CA 94558 and is currently estimated at $2,139,022, approximately $534 per square foot. 3065 Vichy Ave is a home located in Napa County with nearby schools including Vichy Elementary School, Silverado Middle School, and Vintage High School.
Ownership History
Date
Name
Owned For
Owner Type
Purchase Details
Closed on
Jul 23, 2009
Sold by
Wells Fargo Bank Na
Bought by
Padowan Christopher J and Hauser Karen M
Current Estimated Value
Home Financials for this Owner
Home Financials are based on the most recent Mortgage that was taken out on this home.
Original Mortgage
$602,400
Outstanding Balance
$392,965
Interest Rate
5.3%
Mortgage Type
Purchase Money Mortgage
Estimated Equity
$1,746,057
Purchase Details
Closed on
Mar 26, 2009
Sold by
Castro Jose A and Castro Maria Elena
Bought by
Wells Fargo Bank Na
Purchase Details
Closed on
Dec 13, 1999
Sold by
Castro Jose A and Anguiano Jessie
Bought by
Castro Jose A and Castro Maria Elena
Purchase Details
Closed on
Jan 6, 1998
Sold by
Bates Linda L and The Feigel Family 1989 Revocab
Bought by
Castro Jose A and Anguiano Jessie
Purchase Details
Closed on
Dec 2, 1997
Sold by
Castro Maria Elena
Bought by
Castro Jose A
Create a Home Valuation Report for This Property
The Home Valuation Report is an in-depth analysis detailing your home's value as well as a comparison with similar homes in the area
Home Values in the Area
Average Home Value in this Area
Purchase History
| Date | Buyer | Sale Price | Title Company |
|---|---|---|---|
| Padowan Christopher J | $753,000 | Lsi Title Company | |
| Wells Fargo Bank Na | $1,106,250 | Accommodation | |
| Castro Jose A | $93,000 | Napa Land Title Company | |
| Castro Jose A | $205,000 | North American Title Co | |
| Castro Jose A | -- | North American Title Co |
Source: Public Records
Mortgage History
| Date | Status | Borrower | Loan Amount |
|---|---|---|---|
| Open | Padowan Christopher J | $602,400 |
Source: Public Records
Tax History Compared to Growth
Tax History
| Year | Tax Paid | Tax Assessment Tax Assessment Total Assessment is a certain percentage of the fair market value that is determined by local assessors to be the total taxable value of land and additions on the property. | Land | Improvement |
|---|---|---|---|---|
| 2025 | $12,421 | $1,159,424 | $450,712 | $708,712 |
| 2024 | $12,421 | $1,136,691 | $441,875 | $694,816 |
| 2023 | $12,421 | $1,114,404 | $433,211 | $681,193 |
| 2022 | $12,013 | $1,092,554 | $424,717 | $667,837 |
| 2021 | $11,831 | $1,071,133 | $416,390 | $654,743 |
| 2020 | $11,738 | $1,060,151 | $412,121 | $648,030 |
| 2019 | $11,518 | $1,039,365 | $404,041 | $635,324 |
| 2018 | $11,408 | $1,018,986 | $396,119 | $622,867 |
| 2017 | $11,225 | $999,006 | $388,352 | $610,654 |
| 2016 | $11,123 | $979,419 | $380,738 | $598,681 |
| 2015 | $10,469 | $964,708 | $375,019 | $589,689 |
| 2014 | $10,323 | $945,811 | $367,673 | $578,138 |
Source: Public Records
Map
Nearby Homes
- 2060 Hagen Rd
- 3000 Hagen Rd
- 3120 Vichy Ave
- 3180 Vichy Ave
- 2297 1st Ave
- 1057 La Grande Ave
- 2205 Loma Heights Rd
- 2231 1st Ave
- 1101 Olive Hill Ln
- 1111 Olive Hill Ln
- 1776 Monticello Rd
- 2015 Monticello Rd
- 2049 Monticello Rd
- 1180 Monticello Rd
- 2143 Monticello Rd
- 15 Rosemont Cir
- 1114 Mount George Ave
- 1101 Hedgeside Ave
- 2134 Monticello Rd
- 2152 Monticello Rd