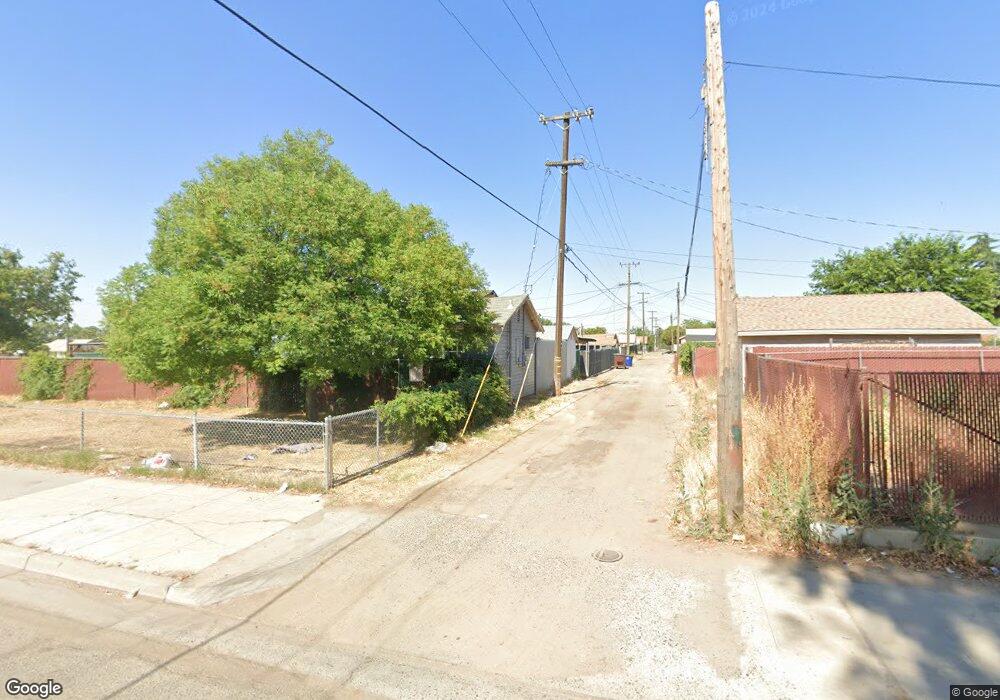
3067 E Nevada Ave Fresno, CA 93701
Huntington NeighborhoodEstimated Value: $233,000 - $374,000
2
Beds
--
Bath
988
Sq Ft
$274/Sq Ft
Est. Value
About This Home
This home is located at 3067 E Nevada Ave, Fresno, CA 93701 and is currently estimated at $270,419, approximately $273 per square foot. 3067 E Nevada Ave is a home located in Fresno County with nearby schools including Jefferson Elementary School, Tehipite Middle School, and Roosevelt High School.
Ownership History
Date
Name
Owned For
Owner Type
Purchase Details
Closed on
Jun 15, 2015
Sold by
Mro Investments Inc
Bought by
Guevara Yolanda
Current Estimated Value
Purchase Details
Closed on
May 7, 2015
Sold by
Lopez Tara T
Bought by
Mro Investments Inc
Purchase Details
Closed on
May 30, 2012
Sold by
Johnson Gayle V
Bought by
Lopez Tara T
Purchase Details
Closed on
May 26, 2012
Sold by
Johnson Gayle V
Bought by
Lopez Tara T
Purchase Details
Closed on
May 25, 2012
Sold by
Johnson Gayle V
Bought by
Lopez Tara T
Purchase Details
Closed on
May 24, 2012
Sold by
Johnson Gayle V
Bought by
Lopez Tara T
Purchase Details
Closed on
May 19, 2012
Sold by
Lopez Tara T
Bought by
Johnson Gayle
Purchase Details
Closed on
Mar 16, 2004
Sold by
Lott Ronald W and Lott Silvia M
Bought by
Johnson Gayle Virginia
Purchase Details
Closed on
Feb 24, 1998
Sold by
Lott Erma L
Bought by
Lott Ronald W and Lott Silvia M
Create a Home Valuation Report for This Property
The Home Valuation Report is an in-depth analysis detailing your home's value as well as a comparison with similar homes in the area
Home Values in the Area
Average Home Value in this Area
Purchase History
| Date | Buyer | Sale Price | Title Company |
|---|---|---|---|
| Guevara Yolanda | $58,000 | Placer Title Company | |
| Mro Investments Inc | $15,000 | Placer Title Company | |
| Lopez Tara T | -- | None Available | |
| Lopez Tara T | -- | None Available | |
| Lopez Tara T | -- | None Available | |
| Lopez Tara T | -- | None Available | |
| Johnson Gayle | -- | None Available | |
| Johnson Gayle Virginia | $65,000 | Fidelity National Title Co | |
| Lott Ronald W | -- | -- |
Source: Public Records
Tax History Compared to Growth
Tax History
| Year | Tax Paid | Tax Assessment Tax Assessment Total Assessment is a certain percentage of the fair market value that is determined by local assessors to be the total taxable value of land and additions on the property. | Land | Improvement |
|---|---|---|---|---|
| 2025 | $900 | $69,577 | $24,033 | $45,544 |
| 2023 | $884 | $66,876 | $23,100 | $43,776 |
| 2022 | $872 | $65,566 | $22,648 | $42,918 |
| 2021 | $849 | $64,281 | $22,204 | $42,077 |
| 2020 | $845 | $63,623 | $21,977 | $41,646 |
| 2019 | $814 | $62,377 | $21,547 | $40,830 |
| 2018 | $796 | $61,155 | $21,125 | $40,030 |
| 2017 | $783 | $59,957 | $20,711 | $39,246 |
| 2016 | $758 | $58,782 | $20,305 | $38,477 |
| 2015 | $834 | $65,000 | $25,000 | $40,000 |
| 2014 | $645 | $50,000 | $25,000 | $25,000 |
Source: Public Records
Map
Nearby Homes
- 3051 E Mckenzie Ave
- 3040 E Washington Ave
- 2966 E Illinois Ave
- 408 N Orchard St
- 3223 E Madison Ave
- 3021 E Belmont Ave
- 3349 E Platt Ave
- 3023 E White Ave
- 244 N U St
- 3427 E Madison Ave
- 2524 E Grant Ave
- 349 N Fresno St
- 3614 E Washington Ave
- 607 N 4th St
- 535 N 5th St
- 2909 Huntington Blvd Unit 133
- 2909 Huntington Blvd Unit 145
- 2909 Huntington Blvd Unit 229
- 2909 Huntington Blvd Unit 207
- 3171 E Balch Ave
- 3065 E Nevada Ave
- 3051 E Nevada Ave
- 3068 E Mckenzie Ave
- 3076 E Mckenzie Ave
- 3060 E Mckenzie Ave
- 3056 E Mckenzie Ave
- 3103 E Nevada Ave
- 3055 E Nevada Ave
- 3052 E Mckenzie Ave
- 3045 E Nevada Ave
- 3109 E Nevada Ave
- 3044 E Mckenzie Ave
- 3040 E Nevada Ave
- 3041 E Nevada Ave
- 3118 E Mckenzie Ave
- 3115 E Nevada Ave
- 3120 E Mckenzie Ave
- 3038 E Nevada Ave
- 3112 E Nevada Ave
- 3033 E Nevada Ave