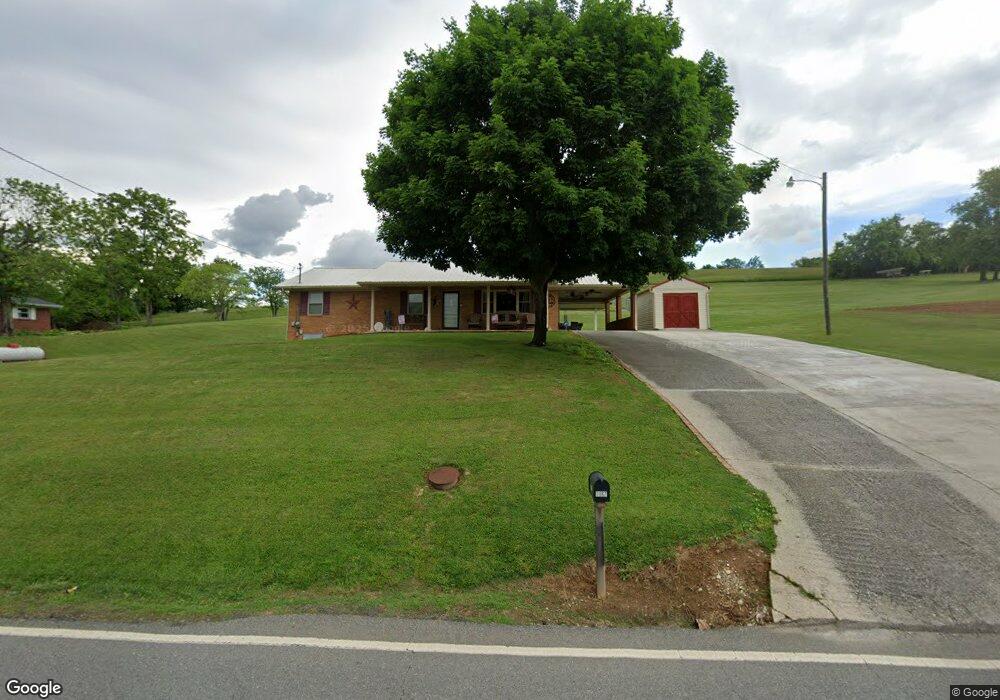
3067 Springvale Rd Morristown, TN 37813
Estimated Value: $258,000 - $300,000
--
Bed
1
Bath
1,421
Sq Ft
$197/Sq Ft
Est. Value
About This Home
This home is located at 3067 Springvale Rd, Morristown, TN 37813 and is currently estimated at $280,000, approximately $197 per square foot. 3067 Springvale Rd is a home located in Hamblen County with nearby schools including Union Heights Elementary School, East Ridge Middle School, and Morristown East High School.
Ownership History
Date
Name
Owned For
Owner Type
Purchase Details
Closed on
Apr 29, 2015
Sold by
Gardner Jeffrey Charles
Bought by
Underwood Frederick Allan and Underwood Barbara A
Current Estimated Value
Purchase Details
Closed on
Mar 10, 2015
Sold by
Gardner Margaret M
Bought by
Gardner Jeffrey Charles and King Vicki Gardner
Purchase Details
Closed on
Aug 23, 2007
Bought by
Gardner Margaret M Living Trust 10/14/98
Purchase Details
Closed on
Sep 21, 1993
Bought by
Underwood Frederick Allan and Underwood Barbara
Purchase Details
Closed on
Mar 23, 1989
Bought by
Gardner Vicki Lynne
Purchase Details
Closed on
Feb 1, 1988
Bought by
Gardner Charles and Gardner Margaret
Purchase Details
Closed on
Jan 23, 1988
Bought by
Gardner Charles E and Gardner Margaret F
Purchase Details
Closed on
Jun 20, 1972
Bought by
Barnette Walter and Barnette Tava
Purchase Details
Closed on
Feb 15, 1972
Bought by
Barnett Walter and Barnett Tava
Create a Home Valuation Report for This Property
The Home Valuation Report is an in-depth analysis detailing your home's value as well as a comparison with similar homes in the area
Home Values in the Area
Average Home Value in this Area
Purchase History
| Date | Buyer | Sale Price | Title Company |
|---|---|---|---|
| Underwood Frederick Allan | $17,100 | -- | |
| Gardner Jeffrey Charles | -- | -- | |
| Gardner Margaret M Living Trust 10/14/98 | -- | -- | |
| Underwood Frederick Allan | $65,000 | -- | |
| Gardner Vicki Lynne | $47,000 | -- | |
| Gardner Charles | $6,700 | -- | |
| Gardner Charles E | $38,000 | -- | |
| Barnette Walter | $2,800 | -- | |
| Barnett Walter | -- | -- |
Source: Public Records
Tax History Compared to Growth
Tax History
| Year | Tax Paid | Tax Assessment Tax Assessment Total Assessment is a certain percentage of the fair market value that is determined by local assessors to be the total taxable value of land and additions on the property. | Land | Improvement |
|---|---|---|---|---|
| 2024 | $687 | $34,875 | $7,450 | $27,425 |
| 2023 | $687 | $34,875 | $0 | $0 |
| 2022 | $687 | $34,875 | $7,450 | $27,425 |
| 2021 | $687 | $34,875 | $7,450 | $27,425 |
| 2020 | $687 | $34,875 | $7,450 | $27,425 |
| 2019 | $693 | $32,525 | $8,525 | $24,000 |
| 2018 | $693 | $32,525 | $8,525 | $24,000 |
| 2017 | $693 | $32,525 | $8,525 | $24,000 |
| 2016 | $645 | $32,525 | $8,525 | $24,000 |
| 2015 | $599 | $32,400 | $8,525 | $23,875 |
| 2014 | -- | $32,400 | $8,525 | $23,875 |
| 2013 | -- | $29,200 | $0 | $0 |
Source: Public Records
Map
Nearby Homes
- 2840-2830 Robinson Creek Rd
- 0 Springvale Rd
- 3080 Chucky River Rd
- 2205 Kingswood Dr
- 2137 Highview Dr
- 2280 Kingswood Dr
- 1744 Carroll Rd
- 4520 Enka Hwy
- 2036 River View Dr
- 2034 River View Dr
- 2034 River View Dr Unit 1
- 1496 Dover Rd
- 58/Ac Tbd River View Dr
- 58/Ac Tbd River View Dr Unit 2
- 4249 Oak Trace Dr
- 4207 Clyde Thomas Rd
- 0 Tbd River View Dr Unit Lot@WP001
- 4271 Stansberry Rd
- 4234 Bayberry Dr
- 1689 Carroll Rd
- 17.6 acres Wolf Creek Rd
- 32 Acres Wolf Creek Rd
- 3024 Springvale Rd
- 3047 Springvale Rd
- 3018 Springvale Rd
- 3087 Springvale Rd
- 3040 Springvale Rd
- 3027 Springvale Rd
- 3435 Robinson Creek Rd
- 3097 Springvale Rd
- 3014 Springvale Rd
- 3008 Springvale Rd
- 3375 Robinson Creek Rd
- 3375 Robinson Creek Rd
- 3057 McClister Rd
- 3061 McClister Rd
- 3301 Robinson Creek Rd
- 3250 Robinson Creek Rd
- 3325 Robinson Creek Rd
- 3074 Springvale Rd