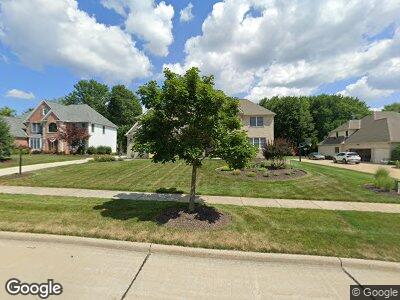
3068 Osage Way Broadview Heights, OH 44147
Estimated Value: $558,762 - $698,000
4
Beds
3
Baths
3,620
Sq Ft
$171/Sq Ft
Est. Value
About This Home
This home is located at 3068 Osage Way, Broadview Heights, OH 44147 and is currently estimated at $617,691, approximately $170 per square foot. 3068 Osage Way is a home located in Cuyahoga County with nearby schools including North Royalton Middle School, North Royalton High School, and Assumption Academy.
Ownership History
Date
Name
Owned For
Owner Type
Purchase Details
Closed on
Apr 14, 2023
Sold by
Sweetnich Paul M and Sweetnich Diane R
Bought by
Fogarty Jason and Fogarty Daniel
Current Estimated Value
Purchase Details
Closed on
Apr 21, 2000
Sold by
Main Street Builders Inc
Bought by
Booth Danny R and Booth Cheryl L
Home Financials for this Owner
Home Financials are based on the most recent Mortgage that was taken out on this home.
Original Mortgage
$90,000
Interest Rate
8.24%
Purchase Details
Closed on
Feb 5, 1999
Sold by
Oakwood Development Company
Bought by
Main Street Builders Inc
Home Financials for this Owner
Home Financials are based on the most recent Mortgage that was taken out on this home.
Original Mortgage
$500,000
Interest Rate
7.05%
Mortgage Type
Credit Line Revolving
Create a Home Valuation Report for This Property
The Home Valuation Report is an in-depth analysis detailing your home's value as well as a comparison with similar homes in the area
Home Values in the Area
Average Home Value in this Area
Purchase History
| Date | Buyer | Sale Price | Title Company |
|---|---|---|---|
| Fogarty Jason | $570,100 | Title One | |
| Booth Danny R | $328,000 | Title First Agency Inc | |
| Main Street Builders Inc | $72,500 | Midland Title Security Inc |
Source: Public Records
Mortgage History
| Date | Status | Borrower | Loan Amount |
|---|---|---|---|
| Previous Owner | Booth Danny R | $115,000 | |
| Previous Owner | Booth Danny R | $150,000 | |
| Previous Owner | Booth Danny R | $150,000 | |
| Previous Owner | Booth Danny R | $150,000 | |
| Previous Owner | Booth Danny R | $100,000 | |
| Previous Owner | Booth Danny R | $90,000 | |
| Previous Owner | Main Street Builders Inc | $1,000,000 | |
| Previous Owner | Main Street Builders Inc | $500,000 | |
| Closed | Booth Danny R | $145,300 |
Source: Public Records
Tax History Compared to Growth
Tax History
| Year | Tax Paid | Tax Assessment Tax Assessment Total Assessment is a certain percentage of the fair market value that is determined by local assessors to be the total taxable value of land and additions on the property. | Land | Improvement |
|---|---|---|---|---|
| 2024 | $11,044 | $179,375 | $31,605 | $147,770 |
| 2023 | $9,204 | $138,640 | $28,880 | $109,760 |
| 2022 | $9,144 | $138,640 | $28,880 | $109,760 |
| 2021 | $9,284 | $138,640 | $28,880 | $109,760 |
| 2020 | $9,335 | $133,280 | $27,760 | $105,530 |
| 2019 | $9,074 | $380,800 | $79,300 | $301,500 |
| 2018 | $8,865 | $133,280 | $27,760 | $105,530 |
| 2017 | $8,997 | $126,880 | $28,810 | $98,070 |
| 2016 | $8,566 | $126,880 | $28,810 | $98,070 |
| 2015 | $7,984 | $126,880 | $28,810 | $98,070 |
| 2014 | $7,984 | $119,880 | $26,920 | $92,960 |
Source: Public Records
Map
Nearby Homes
- 2364 W Royalton Rd
- 8900 Chaucer Blvd
- 9135 Ledge View Terrace
- 9145 Ledge View Terrace
- 9648 Scottsdale Dr
- 1893 W Royalton Rd
- 13900 Stoney Creek Dr
- 9388 Scottsdale Dr
- 3963 Royalton Rd
- 2821 Amelia Dr
- 947 Tollis Pkwy Unit 28
- 4370 Sir John Ave
- 2901 Crystalwood Dr
- 8663 Scenicview Dr
- 721 Tollis Pkwy Unit 68
- 753 Tollis Pkwy Unit 14-08
- 625 Tollis Pkwy
- 8026 Broadview Rd
- V/L Akins Rd
- 696 Tollis Pkwy Unit A
- 3068 Osage Way
- 3074 Osage Way
- 3062 Osage Way
- 3080 Osage Way
- 3056 Osage Way
- 3067 Osage Way
- 3073 Osage Way
- 3086 Osage Way
- 3079 Osage Way
- 3511 Hawthorne Trail
- 3515 Hawthorne Trail
- 3085 Osage Way
- 3092 Osage Way
- 3519 Hawthorne Trail
- 3091 Osage Way
- 3390 Magnolia Way
- 3394 Magnolia Way
- 3523 Hawthorne Trail
- 3398 Magnolia Way
- 3098 Osage Way