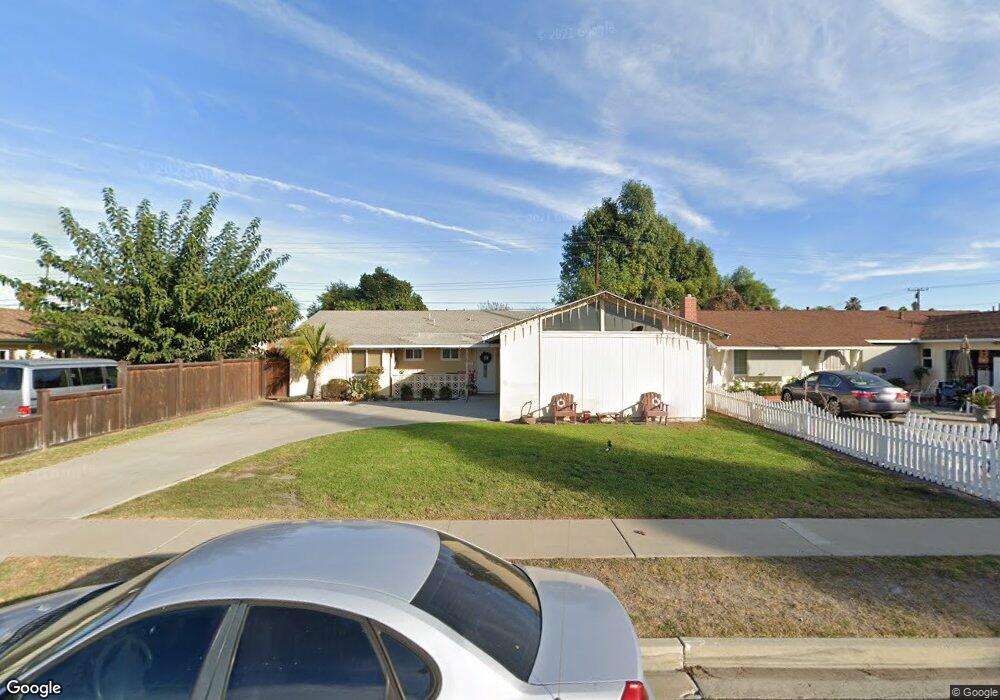
3068 Tyler Way Costa Mesa, CA 92626
Northside Costa Mesa NeighborhoodEstimated Value: $861,000 - $1,392,000
3
Beds
2
Baths
1,292
Sq Ft
$917/Sq Ft
Est. Value
About This Home
This home is located at 3068 Tyler Way, Costa Mesa, CA 92626 and is currently estimated at $1,185,338, approximately $917 per square foot. 3068 Tyler Way is a home located in Orange County with nearby schools including Paularino Elementary School, Costa Mesa High School, and Montessori Christian School.
Ownership History
Date
Name
Owned For
Owner Type
Purchase Details
Closed on
Apr 24, 2017
Sold by
Fries William Joseph and York Fries Sherrie Lynn
Bought by
Fries William Joseph and York Fries Sherrie Lynn
Current Estimated Value
Purchase Details
Closed on
Mar 5, 2007
Sold by
Fries William Joseph and Fries Sherrie Lynn
Bought by
Fries William Joseph and Fries Sherrie Lynn
Home Financials for this Owner
Home Financials are based on the most recent Mortgage that was taken out on this home.
Original Mortgage
$476,500
Interest Rate
6.23%
Mortgage Type
New Conventional
Purchase Details
Closed on
Apr 6, 2004
Sold by
York Robin L
Bought by
Fries Bill and York Sherrie
Home Financials for this Owner
Home Financials are based on the most recent Mortgage that was taken out on this home.
Original Mortgage
$268,000
Interest Rate
6.62%
Mortgage Type
Purchase Money Mortgage
Purchase Details
Closed on
Jan 4, 2001
Sold by
York Robin L
Bought by
York Robin L and Robin L York Living Trust
Purchase Details
Closed on
Jun 29, 1998
Sold by
York Robin
Bought by
York Robin L
Home Financials for this Owner
Home Financials are based on the most recent Mortgage that was taken out on this home.
Original Mortgage
$91,000
Interest Rate
7%
Create a Home Valuation Report for This Property
The Home Valuation Report is an in-depth analysis detailing your home's value as well as a comparison with similar homes in the area
Home Values in the Area
Average Home Value in this Area
Purchase History
| Date | Buyer | Sale Price | Title Company |
|---|---|---|---|
| Fries William Joseph | -- | None Available | |
| Fries William Joseph | -- | None Available | |
| Fries Bill | $325,000 | Southland Title | |
| York Robin L | -- | -- | |
| York Robin L | -- | First American Title Ins Co |
Source: Public Records
Mortgage History
| Date | Status | Borrower | Loan Amount |
|---|---|---|---|
| Closed | Fries William Joseph | $476,500 | |
| Closed | Fries Bill | $268,000 | |
| Closed | York Robin L | $91,000 | |
| Closed | Fries Bill | $67,000 |
Source: Public Records
Tax History Compared to Growth
Tax History
| Year | Tax Paid | Tax Assessment Tax Assessment Total Assessment is a certain percentage of the fair market value that is determined by local assessors to be the total taxable value of land and additions on the property. | Land | Improvement |
|---|---|---|---|---|
| 2025 | $1,703 | $74,246 | $30,161 | $44,085 |
| 2024 | $1,703 | $72,791 | $29,570 | $43,221 |
| 2023 | $1,593 | $71,364 | $28,990 | $42,374 |
| 2022 | $1,454 | $69,965 | $28,421 | $41,544 |
| 2021 | $1,361 | $68,594 | $27,864 | $40,730 |
| 2020 | $1,333 | $67,891 | $27,578 | $40,313 |
| 2019 | $1,302 | $66,560 | $27,037 | $39,523 |
| 2018 | $1,275 | $65,255 | $26,506 | $38,749 |
| 2017 | $1,258 | $63,976 | $25,986 | $37,990 |
| 2016 | $1,237 | $62,722 | $25,476 | $37,246 |
| 2015 | $1,223 | $61,780 | $25,093 | $36,687 |
| 2014 | $1,199 | $60,570 | $24,601 | $35,969 |
Source: Public Records
Map
Nearby Homes
- 3050 Madison Ave
- 3131 Lincoln Way
- 1081 Tulare Dr
- 1110 Redding Ave
- 3149 Sharon Ln
- 2865 Mendoza Dr
- 1010 Valencia St
- 994 Valencia St
- 945 Brilliance Ln
- 1030 Palmetto Way
- 1387 Garlingford St
- 3375 Fuchsia St
- 3460 San Rafael Cir
- 3351 Via Trentino Unit 76
- 1174 Kingston St
- 924 Jasmine Cir
- 3485 Venetian Dr
- 2511 W Sunflower Ave Unit P6
- 2511 W Sunflower Ave Unit F11
- 2817 Portola Dr
- 3072 Tyler Way
- 3064 Tyler Way
- 3069 Taylor Way
- 3065 Taylor Way
- 3075 Taylor Way
- 3076 Tyler Way
- 3062 Tyler Way
- 3077 Taylor Way
- 3069 Tyler Way
- 3063 Taylor Way
- 3075 Tyler Way
- 3065 Tyler Way
- 3080 Tyler Way
- 3058 Tyler Way
- 3077 Tyler Way
- 3081 Taylor Way
- 3059 Tyler Way
- 3063 Tyler Way
- 3059 Taylor Way
- 3084 Tyler Way