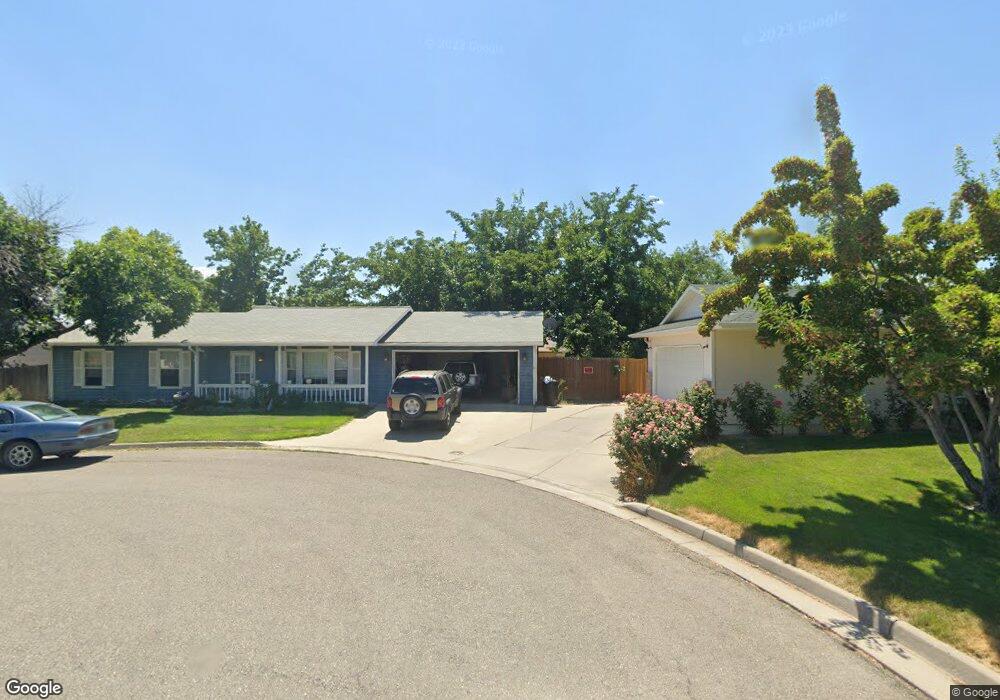
3069 1/2 Dupont Ct Grand Junction, CO 81504
Estimated Value: $347,998 - $365,000
3
Beds
2
Baths
1,351
Sq Ft
$266/Sq Ft
Est. Value
About This Home
This home is located at 3069 1/2 Dupont Ct, Grand Junction, CO 81504 and is currently estimated at $359,500, approximately $266 per square foot. 3069 1/2 Dupont Ct is a home located in Mesa County with nearby schools including Chatfield Elementary School, Grand Mesa Middle School, and Central High School.
Ownership History
Date
Name
Owned For
Owner Type
Purchase Details
Closed on
Aug 8, 2003
Sold by
Rogers Thomas A
Bought by
Strom Todd and Strom Gabrielle J
Current Estimated Value
Purchase Details
Closed on
Oct 3, 2001
Sold by
Rogers Thomas A and Rogers Ellen W
Bought by
Rogers Thomas A
Purchase Details
Closed on
Apr 19, 1999
Sold by
Romano Diana L
Bought by
Rogers Thomas A and Rogers Ellen W
Home Financials for this Owner
Home Financials are based on the most recent Mortgage that was taken out on this home.
Original Mortgage
$89,520
Interest Rate
6.5%
Purchase Details
Closed on
Sep 26, 1996
Sold by
Conk Jack and Conk Fern
Bought by
Romano Diana L
Purchase Details
Closed on
Jul 21, 1994
Sold by
Yeager Wesley
Bought by
Strom Todd
Purchase Details
Closed on
Nov 13, 1992
Sold by
Webb Lawrence E
Bought by
Strom Gabrielle J
Purchase Details
Closed on
Sep 15, 1989
Sold by
Invest In Colo West Inc
Bought by
Strom Gabrielle J
Purchase Details
Closed on
Sep 5, 1989
Sold by
United Bank Of Grand Junction N A
Bought by
Strom Gabrielle J
Create a Home Valuation Report for This Property
The Home Valuation Report is an in-depth analysis detailing your home's value as well as a comparison with similar homes in the area
Home Values in the Area
Average Home Value in this Area
Purchase History
| Date | Buyer | Sale Price | Title Company |
|---|---|---|---|
| Strom Todd | $128,500 | -- | |
| Rogers Thomas A | -- | -- | |
| Rogers Thomas A | $111,900 | First American Title Co | |
| Romano Diana L | $103,000 | -- | |
| Strom Todd | $89,900 | -- | |
| Strom Gabrielle J | $6,500 | -- | |
| Strom Gabrielle J | $119,600 | -- | |
| Strom Gabrielle J | $119,700 | -- |
Source: Public Records
Mortgage History
| Date | Status | Borrower | Loan Amount |
|---|---|---|---|
| Previous Owner | Rogers Thomas A | $89,520 |
Source: Public Records
Tax History Compared to Growth
Tax History
| Year | Tax Paid | Tax Assessment Tax Assessment Total Assessment is a certain percentage of the fair market value that is determined by local assessors to be the total taxable value of land and additions on the property. | Land | Improvement |
|---|---|---|---|---|
| 2024 | $1,350 | $18,160 | $3,060 | $15,100 |
| 2023 | $1,350 | $18,160 | $3,060 | $15,100 |
| 2022 | $1,206 | $15,920 | $3,480 | $12,440 |
| 2021 | $1,211 | $16,380 | $3,580 | $12,800 |
| 2020 | $959 | $13,260 | $2,860 | $10,400 |
| 2019 | $910 | $13,260 | $2,860 | $10,400 |
| 2018 | $830 | $11,080 | $2,160 | $8,920 |
| 2017 | $827 | $11,080 | $2,160 | $8,920 |
| 2016 | $778 | $12,030 | $2,190 | $9,840 |
| 2015 | $788 | $12,030 | $2,190 | $9,840 |
| 2014 | $741 | $11,330 | $1,990 | $9,340 |
Source: Public Records
Map
Nearby Homes
- 3084 Aberdeen Ln
- 3065 Cardinal Ct
- 453 Washburn St
- 488 E Valley St
- 420 Pear Ln
- 421 Pear Ln
- 3065 Thrush Dr
- 3058 Austin Ct
- 498 Sheldon Rd
- 418 Steven Creek St
- 424 Steven Creek St
- 3040 Teller Ave
- 426 Iola Basin St
- 458 Ananessa Dr
- 424 Morning Dove Dr
- 3119 Chipeta Ave
- 3051 Hawkwood Ct
- 465 Tanner St
- 495 Mcmullin Dr
- 426 Steven Creek St