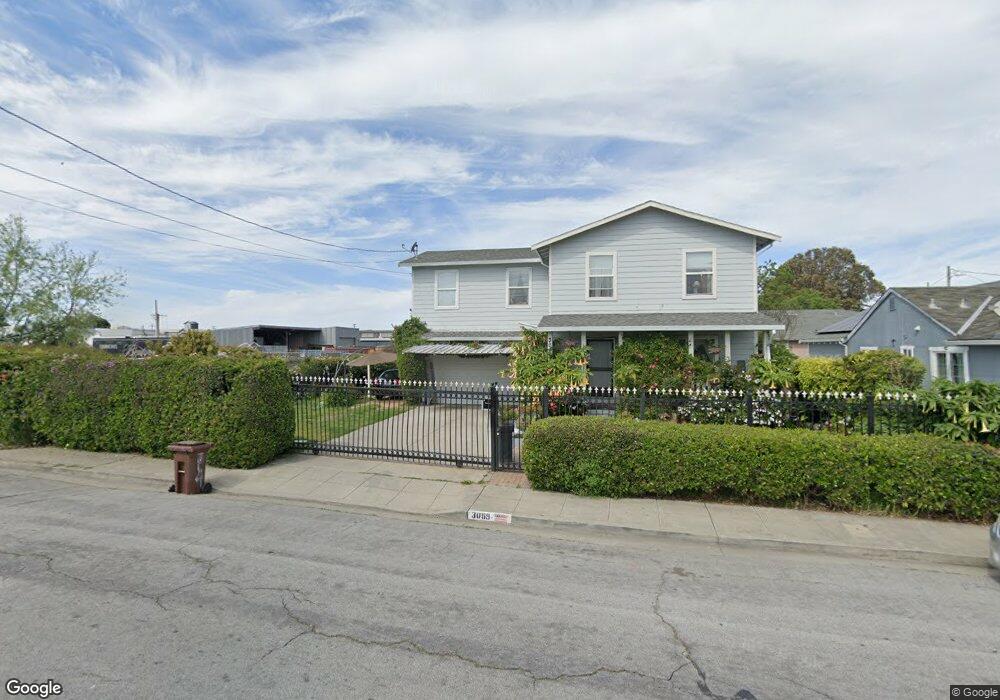
3069 11th St San Pablo, CA 94806
Estimated Value: $650,000 - $697,861
4
Beds
3
Baths
1,680
Sq Ft
$401/Sq Ft
Est. Value
About This Home
This home is located at 3069 11th St, San Pablo, CA 94806 and is currently estimated at $672,965, approximately $400 per square foot. 3069 11th St is a home located in Contra Costa County with nearby schools including Bayview Elementary School, Betty Reid Soskin Middle School, and De Anza Senior High School.
Ownership History
Date
Name
Owned For
Owner Type
Purchase Details
Closed on
Jul 22, 2003
Sold by
Sanchez Edson
Bought by
Alfaro Raul and Reales Angela Flores
Current Estimated Value
Home Financials for this Owner
Home Financials are based on the most recent Mortgage that was taken out on this home.
Original Mortgage
$252,000
Outstanding Balance
$106,249
Interest Rate
5.15%
Mortgage Type
Stand Alone First
Estimated Equity
$566,716
Purchase Details
Closed on
Apr 17, 2003
Sold by
Silva Sergio C
Bought by
Sanchez Edson
Home Financials for this Owner
Home Financials are based on the most recent Mortgage that was taken out on this home.
Original Mortgage
$350,000
Interest Rate
5.6%
Mortgage Type
Seller Take Back
Purchase Details
Closed on
Jun 8, 1998
Sold by
Golden William F and Golden Anna J
Bought by
Golden William F and Golden Anna J
Create a Home Valuation Report for This Property
The Home Valuation Report is an in-depth analysis detailing your home's value as well as a comparison with similar homes in the area
Home Values in the Area
Average Home Value in this Area
Purchase History
| Date | Buyer | Sale Price | Title Company |
|---|---|---|---|
| Alfaro Raul | $360,000 | Chicago Title | |
| Sanchez Edson | -- | -- | |
| Golden William F | -- | -- | |
| Golden William F | -- | -- | |
| Golden William F | -- | -- | |
| Golden William F | -- | -- |
Source: Public Records
Mortgage History
| Date | Status | Borrower | Loan Amount |
|---|---|---|---|
| Open | Alfaro Raul | $252,000 | |
| Previous Owner | Sanchez Edson | $350,000 | |
| Closed | Alfaro Raul | $36,000 |
Source: Public Records
Tax History Compared to Growth
Tax History
| Year | Tax Paid | Tax Assessment Tax Assessment Total Assessment is a certain percentage of the fair market value that is determined by local assessors to be the total taxable value of land and additions on the property. | Land | Improvement |
|---|---|---|---|---|
| 2025 | $7,620 | $511,827 | $248,805 | $263,022 |
| 2024 | $7,457 | $501,792 | $243,927 | $257,865 |
| 2023 | $7,457 | $491,954 | $239,145 | $252,809 |
| 2022 | $7,353 | $482,308 | $234,456 | $247,852 |
| 2021 | $7,320 | $472,852 | $229,859 | $242,993 |
| 2019 | $6,913 | $458,830 | $223,043 | $235,787 |
| 2018 | $6,187 | $413,000 | $200,765 | $212,235 |
| 2017 | $5,749 | $382,000 | $185,696 | $196,304 |
| 2016 | $4,877 | $312,500 | $151,910 | $160,590 |
| 2015 | $4,458 | $278,000 | $135,139 | $142,861 |
| 2014 | $3,968 | $238,500 | $115,938 | $122,562 |
Source: Public Records
Map
Nearby Homes
- 1111 Stonington Ave
- 2872 10th St Unit 70
- 1371 Palmer Ave
- 2817 13th St
- 2717 10th St
- 2716 Holly St
- 1305 John Ave
- 2796 13th St
- 2854 16th St
- 1415 Miner Ave
- 2867 18th St
- 1911 Miner Ave
- 19 Haviland Ct
- 2600 Giant Rd Unit 28
- 3316 Monte Buena St
- 2518 Manchester Ave
- 2830 21st St Unit 32
- 2011 Espanola Dr
- 113 Westgate Cir
- 112 Westgate Cir
- 1014 Connecticut Ave
- 1018 Connecticut Ave
- 1010 Connecticut Ave
- 3058 11th St
- 3060 11th St
- 3054 11th St
- 3111 11th St
- 3062 11th St
- 3024 11th St Unit 1
- 1013 Connecticut Ave
- 1009 Connecticut Ave
- 3119 11th St
- 1120 Connecticut Ave
- 1101 Connecticut Ave
- 1101 Connecticut Ave
- 3018 11th St
- 3065 12th St
- 2989 12th St
- 2981 12th St
- 1115 Connecticut Ave