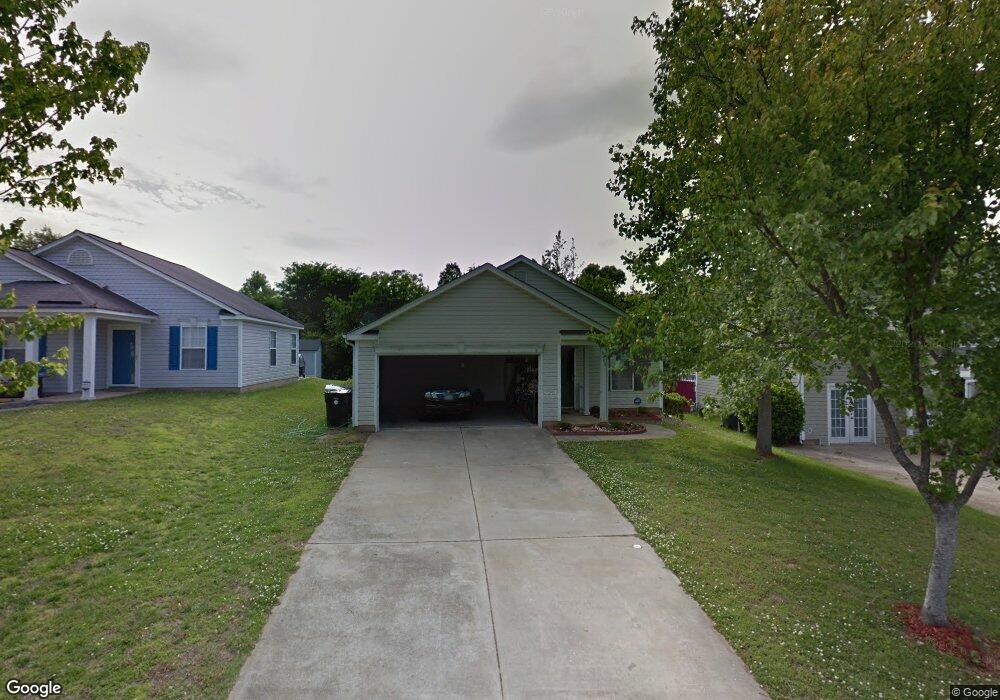
3069 Parade Ln SW Concord, NC 28025
Estimated Value: $285,000 - $298,000
4
Beds
2
Baths
1,518
Sq Ft
$193/Sq Ft
Est. Value
About This Home
This home is located at 3069 Parade Ln SW, Concord, NC 28025 and is currently estimated at $292,492, approximately $192 per square foot. 3069 Parade Ln SW is a home located in Cabarrus County with nearby schools including Rocky River Elementary School, J.N. Fries Middle School, and The Daniel Academy of Concord.
Ownership History
Date
Name
Owned For
Owner Type
Purchase Details
Closed on
Jun 28, 2016
Sold by
Crew Amy Jo and Crew Jeffrey R
Bought by
Crew Family Lp
Current Estimated Value
Purchase Details
Closed on
Nov 26, 2008
Sold by
Bost Rebecca Lynne and Bost Curtis Clegg
Bought by
Crew Amy Jo
Home Financials for this Owner
Home Financials are based on the most recent Mortgage that was taken out on this home.
Original Mortgage
$127,072
Interest Rate
6.51%
Mortgage Type
FHA
Purchase Details
Closed on
Sep 18, 1998
Sold by
Beazer Homes Corp
Bought by
Payne Rebecca
Home Financials for this Owner
Home Financials are based on the most recent Mortgage that was taken out on this home.
Original Mortgage
$92,400
Interest Rate
6.95%
Create a Home Valuation Report for This Property
The Home Valuation Report is an in-depth analysis detailing your home's value as well as a comparison with similar homes in the area
Home Values in the Area
Average Home Value in this Area
Purchase History
| Date | Buyer | Sale Price | Title Company |
|---|---|---|---|
| Crew Family Lp | $120,000 | None Available | |
| Crew Amy Jo | $129,000 | None Available | |
| Payne Rebecca | $116,000 | -- |
Source: Public Records
Mortgage History
| Date | Status | Borrower | Loan Amount |
|---|---|---|---|
| Previous Owner | Crew Amy Jo | $127,072 | |
| Previous Owner | Payne Rebecca | $92,400 |
Source: Public Records
Tax History Compared to Growth
Tax History
| Year | Tax Paid | Tax Assessment Tax Assessment Total Assessment is a certain percentage of the fair market value that is determined by local assessors to be the total taxable value of land and additions on the property. | Land | Improvement |
|---|---|---|---|---|
| 2025 | $2,803 | $281,410 | $65,000 | $216,410 |
| 2024 | $2,803 | $281,410 | $65,000 | $216,410 |
| 2023 | $2,018 | $165,420 | $34,000 | $131,420 |
| 2022 | $2,018 | $165,420 | $34,000 | $131,420 |
| 2021 | $2,018 | $165,420 | $34,000 | $131,420 |
| 2020 | $2,018 | $165,420 | $34,000 | $131,420 |
| 2019 | $1,505 | $123,320 | $18,000 | $105,320 |
| 2018 | $1,480 | $123,320 | $18,000 | $105,320 |
| 2017 | $1,455 | $123,320 | $18,000 | $105,320 |
| 2016 | $863 | $104,640 | $18,000 | $86,640 |
| 2015 | -- | $104,640 | $18,000 | $86,640 |
| 2014 | -- | $104,640 | $18,000 | $86,640 |
Source: Public Records
Map
Nearby Homes
- 3168 Sossamon Place
- 3073 Champion Ln SW
- 493 Debra Cir SW
- 518 Viking Place SW
- 2824 Trestle Ct SW
- 2893 Signal Ct SW
- 609 Faith Dr SW Unit 1
- 1255 Old Charlotte Rd
- Lot #2 Faith Dr SW
- 809 Fargo Dr SW
- 84 Highland Ave SW
- 82 Highland Ave SW
- 4285 Long Arrow Dr
- 758 Main St SW
- 782 Chalice St SW
- 1067 Old Charlotte Rd
- 664 Jackson Terrace SW
- 668 Jackson Terrace SW
- 668 Shellbark Dr
- 760 Bartram Ave Unit 114
- 3065 Parade Ln SW
- 3065 Parade Ln SW Unit 121
- 3073 Parade Ln SW
- 3077 Parade Ln SW
- 3061 Parade Ln SW
- 3061 Parade Ln SW Unit 120
- 3057 Parade Ln SW
- 532 Garrison Ct SW
- 528 Garrison Ct SW
- 3046 Champion Ln SW
- 3081 Parade Ln SW
- 3044 Champion Ln SW
- 536 Garrison Ct SW
- 3064 Parade Ln SW
- 3053 Parade Ln SW
- 3068 Parade Ln SW
- 3060 Parade Ln SW
- 3072 Parade Ln SW
- 3076 Parade Ln SW
- 3076 Parade Ln SW Unit 95