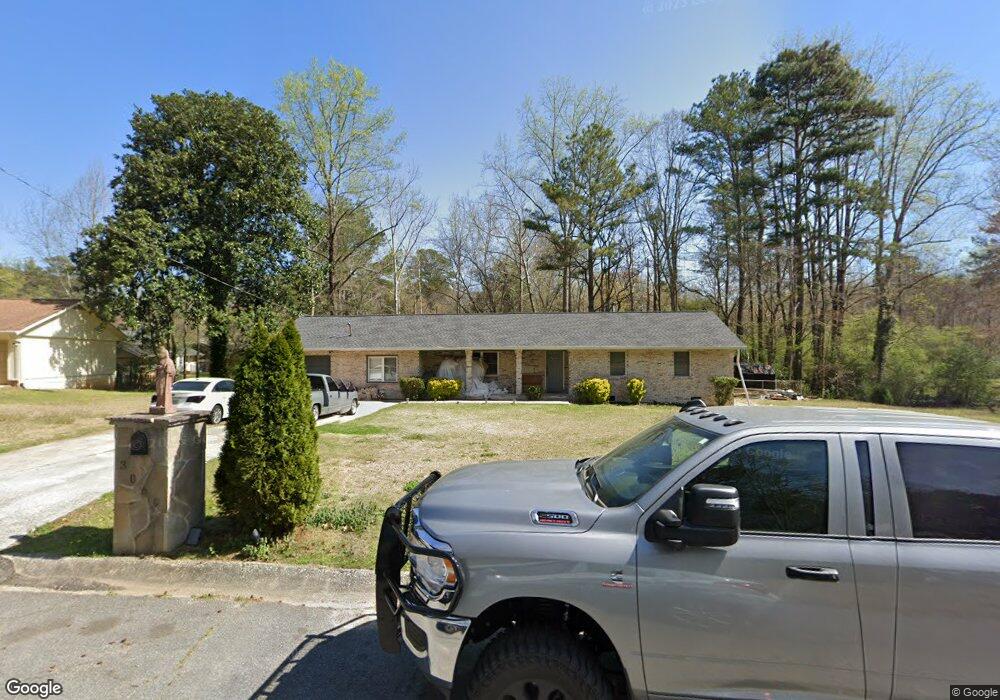
3069 Sasanqua Ln SW Marietta, GA 30008
Southwestern Marietta NeighborhoodEstimated Value: $294,000 - $320,000
4
Beds
2
Baths
1,597
Sq Ft
$193/Sq Ft
Est. Value
About This Home
This home is located at 3069 Sasanqua Ln SW, Marietta, GA 30008 and is currently estimated at $308,951, approximately $193 per square foot. 3069 Sasanqua Ln SW is a home located in Cobb County with nearby schools including Hollydale Elementary School, Smitha Middle School, and Osborne High School.
Ownership History
Date
Name
Owned For
Owner Type
Purchase Details
Closed on
Dec 12, 2011
Sold by
Nicro June 2011 Llc
Bought by
Rodriguez Hugo Sanchez
Current Estimated Value
Home Financials for this Owner
Home Financials are based on the most recent Mortgage that was taken out on this home.
Original Mortgage
$65,886
Outstanding Balance
$45,424
Interest Rate
4.25%
Mortgage Type
FHA
Estimated Equity
$263,527
Purchase Details
Closed on
Jul 23, 2004
Sold by
Wadsworth Allan D
Bought by
Pelico Julio V
Home Financials for this Owner
Home Financials are based on the most recent Mortgage that was taken out on this home.
Original Mortgage
$127,850
Interest Rate
6.24%
Mortgage Type
New Conventional
Purchase Details
Closed on
Mar 30, 1994
Sold by
Halcomb Deborah J
Bought by
Wadsworth Allan D
Home Financials for this Owner
Home Financials are based on the most recent Mortgage that was taken out on this home.
Original Mortgage
$73,050
Interest Rate
7.26%
Mortgage Type
FHA
Create a Home Valuation Report for This Property
The Home Valuation Report is an in-depth analysis detailing your home's value as well as a comparison with similar homes in the area
Home Values in the Area
Average Home Value in this Area
Purchase History
| Date | Buyer | Sale Price | Title Company |
|---|---|---|---|
| Rodriguez Hugo Sanchez | $67,600 | -- | |
| Pelico Julio V | $128,000 | -- | |
| Wadsworth Allan D | $74,000 | -- |
Source: Public Records
Mortgage History
| Date | Status | Borrower | Loan Amount |
|---|---|---|---|
| Open | Rodriguez Hugo Sanchez | $65,886 | |
| Previous Owner | Pelico Julio V | $127,850 | |
| Previous Owner | Wadsworth Allan D | $73,050 |
Source: Public Records
Tax History Compared to Growth
Tax History
| Year | Tax Paid | Tax Assessment Tax Assessment Total Assessment is a certain percentage of the fair market value that is determined by local assessors to be the total taxable value of land and additions on the property. | Land | Improvement |
|---|---|---|---|---|
| 2025 | $2,525 | $111,060 | $30,000 | $81,060 |
| 2024 | $2,527 | $111,060 | $30,000 | $81,060 |
| 2023 | $1,835 | $104,180 | $20,000 | $84,180 |
| 2022 | $1,616 | $68,520 | $14,000 | $54,520 |
| 2021 | $1,616 | $68,520 | $14,000 | $54,520 |
| 2020 | $1,422 | $59,648 | $14,000 | $45,648 |
| 2019 | $1,422 | $59,648 | $14,000 | $45,648 |
| 2018 | $1,125 | $46,076 | $11,200 | $34,876 |
| 2017 | $1,325 | $46,076 | $11,200 | $34,876 |
| 2016 | $1,007 | $35,040 | $11,200 | $23,840 |
| 2015 | $1,032 | $35,040 | $11,200 | $23,840 |
| 2014 | $803 | $27,032 | $0 | $0 |
Source: Public Records
Map
Nearby Homes
- 3145 Fern Valley Dr SW
- 3106 Sasanqua Ln SW
- 2099 Redbud Ct SW
- 3000 Fern Valley Dr SW
- 3055 Milford Chase Overlook SW
- 1719 Silverchase Dr SW
- 1618 Sparrow Wood Ln SW
- 1613 Sparrow Wood Ln SW Unit 3
- 0 Burfordi Dr SW Unit 7658493
- 0 Burfordi Dr SW Unit 10637361
- 1559 Woodmore Dr SW
- 3112 Patriot Square SW
- 3100 Patriot Square SW
- 3253 Shadowridge Dr SW
- 2318 Powder Springs Rd SW
- 1769 Milford Creek Courts SW
- 3340 Vineland Dr SW
- 0 Sasanqua Ln SW Unit 8685736
- 0 Sasanqua Ln SW Unit 9027880
- 0 Sasanqua Ln SW Unit 3196326
- 0 Sasanqua Ln SW Unit 3275239
- 0 Sasanqua Ln SW Unit 7199998
- 0 Sasanqua Ln SW
- 3063 Sasanqua Ln SW Unit O
- 3063 Sasanqua Ln SW Unit 4
- 3063 Sasanqua Ln SW
- 3077 Sasanqua Ln SW
- 3122 Fern Valley Dr SW
- 3076 Sasanqua Ln SW
- 3130 Fern Valley Dr SW
- 3106 Fern Valley Dr SW Unit 4
- 3080 Sasanqua Ln SW
- 1910 Burkwood Ct SW
- 3117 Fern Valley Dr SW
- 3083 Sasanqua Ln SW
- 3138 Fern Valley Dr SW Unit 4
- 1918 Burkwood Ct SW Unit 4