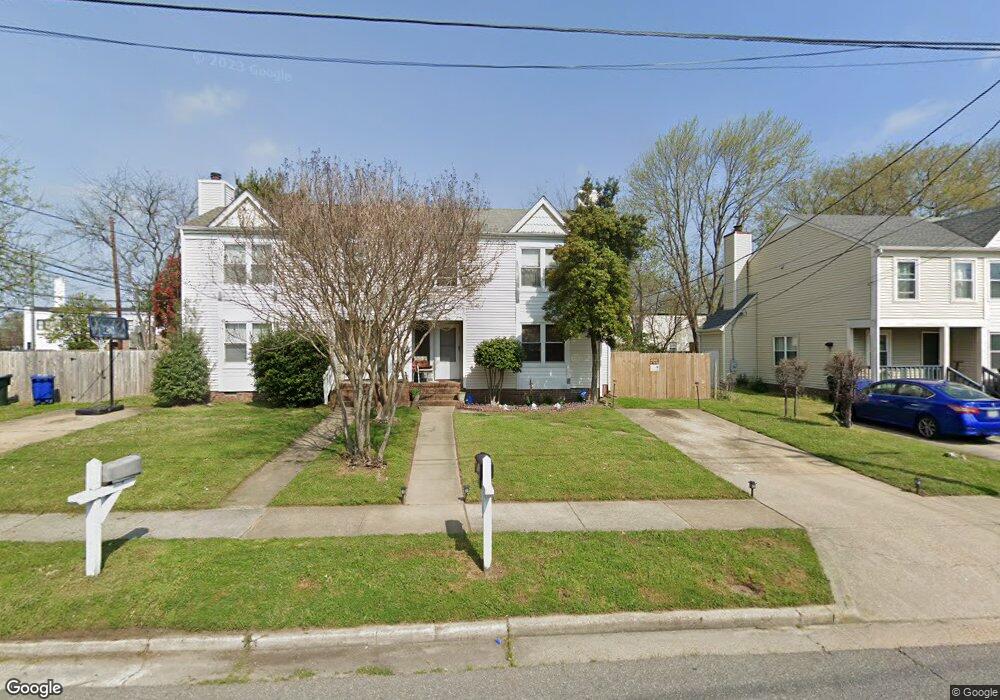
307 49th St Newport News, VA 23607
Estimated Value: $145,000 - $176,869
3
Beds
2
Baths
1,282
Sq Ft
$123/Sq Ft
Est. Value
About This Home
This home is located at 307 49th St, Newport News, VA 23607 and is currently estimated at $158,217, approximately $123 per square foot. 307 49th St is a home located in Newport News City with nearby schools including Riverside Elementary School, Crittenden Middle School, and Heritage High School.
Ownership History
Date
Name
Owned For
Owner Type
Purchase Details
Closed on
Mar 28, 2012
Sold by
Fannie Mae
Bought by
Pettaway Russell T
Current Estimated Value
Home Financials for this Owner
Home Financials are based on the most recent Mortgage that was taken out on this home.
Original Mortgage
$55,920
Outstanding Balance
$38,625
Interest Rate
3.91%
Mortgage Type
New Conventional
Estimated Equity
$119,592
Purchase Details
Closed on
Oct 12, 2011
Sold by
Samuel I White Pc
Bought by
Federal National Mortgage Association
Purchase Details
Closed on
Sep 24, 2004
Sold by
Walker Lynne
Bought by
Green Dominique
Create a Home Valuation Report for This Property
The Home Valuation Report is an in-depth analysis detailing your home's value as well as a comparison with similar homes in the area
Home Values in the Area
Average Home Value in this Area
Purchase History
| Date | Buyer | Sale Price | Title Company |
|---|---|---|---|
| Pettaway Russell T | $69,900 | -- | |
| Federal National Mortgage Association | $130,674 | -- | |
| Green Dominique | $130,300 | -- |
Source: Public Records
Mortgage History
| Date | Status | Borrower | Loan Amount |
|---|---|---|---|
| Open | Pettaway Russell T | $55,920 |
Source: Public Records
Tax History Compared to Growth
Tax History
| Year | Tax Paid | Tax Assessment Tax Assessment Total Assessment is a certain percentage of the fair market value that is determined by local assessors to be the total taxable value of land and additions on the property. | Land | Improvement |
|---|---|---|---|---|
| 2024 | $1,613 | $136,700 | $31,600 | $105,100 |
| 2023 | $1,760 | $136,700 | $31,600 | $105,100 |
| 2022 | $1,655 | $125,700 | $31,600 | $94,100 |
| 2021 | $1,150 | $94,300 | $22,600 | $71,700 |
| 2020 | $1,156 | $82,700 | $20,500 | $62,200 |
| 2019 | $1,115 | $79,700 | $20,500 | $59,200 |
| 2018 | $1,046 | $74,300 | $20,500 | $53,800 |
| 2017 | $1,046 | $74,300 | $20,500 | $53,800 |
| 2016 | $1,041 | $74,300 | $20,500 | $53,800 |
| 2015 | $1,035 | $74,300 | $20,500 | $53,800 |
| 2014 | $1,038 | $74,300 | $20,500 | $53,800 |
Source: Public Records
Map
Nearby Homes