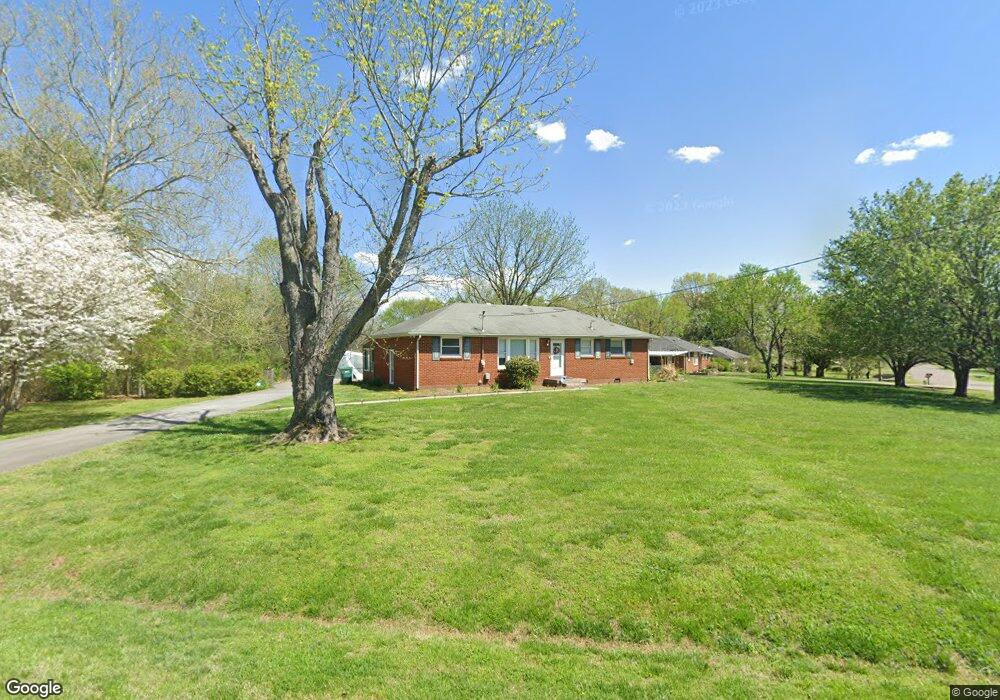
307 Belaire Dr Smyrna, TN 37167
Estimated Value: $269,108 - $311,000
--
Bed
1
Bath
1,275
Sq Ft
$230/Sq Ft
Est. Value
About This Home
This home is located at 307 Belaire Dr, Smyrna, TN 37167 and is currently estimated at $292,777, approximately $229 per square foot. 307 Belaire Dr is a home located in Rutherford County with nearby schools including Smyrna Primary School, Smyrna Middle School, and Smyrna High School.
Ownership History
Date
Name
Owned For
Owner Type
Purchase Details
Closed on
May 25, 2006
Sold by
Veterans Affairs
Bought by
Steve Jones Mark
Current Estimated Value
Home Financials for this Owner
Home Financials are based on the most recent Mortgage that was taken out on this home.
Original Mortgage
$89,964
Interest Rate
6.5%
Mortgage Type
Purchase Money Mortgage
Purchase Details
Closed on
Feb 17, 2006
Sold by
Barrier Arlen L
Bought by
Mortgage Electronic Reg System
Purchase Details
Closed on
Oct 1, 2001
Sold by
Cheatham Lisa A
Bought by
Barrier Arlen I and Barrier Joyce
Home Financials for this Owner
Home Financials are based on the most recent Mortgage that was taken out on this home.
Original Mortgage
$87,500
Interest Rate
6.87%
Purchase Details
Closed on
Mar 3, 1997
Sold by
Lyle Harold R
Bought by
Cheatham and Lisa
Create a Home Valuation Report for This Property
The Home Valuation Report is an in-depth analysis detailing your home's value as well as a comparison with similar homes in the area
Home Values in the Area
Average Home Value in this Area
Purchase History
| Date | Buyer | Sale Price | Title Company |
|---|---|---|---|
| Steve Jones Mark | $112,455 | -- | |
| Steve Jones Mark | $112,455 | -- | |
| Mortgage Electronic Reg System | $93,672 | -- | |
| Barrier Arlen I | $87,500 | -- | |
| Seale Carol A | $89,300 | -- | |
| Cheatham | $80,000 | -- |
Source: Public Records
Mortgage History
| Date | Status | Borrower | Loan Amount |
|---|---|---|---|
| Closed | Steve Jones Mark | $89,964 | |
| Previous Owner | Cheatham | $87,500 |
Source: Public Records
Tax History Compared to Growth
Tax History
| Year | Tax Paid | Tax Assessment Tax Assessment Total Assessment is a certain percentage of the fair market value that is determined by local assessors to be the total taxable value of land and additions on the property. | Land | Improvement |
|---|---|---|---|---|
| 2025 | $1,450 | $60,388 | $13,750 | $46,638 |
| 2024 | $1,450 | $60,388 | $13,750 | $46,638 |
| 2023 | $1,450 | $60,388 | $13,750 | $46,638 |
| 2022 | $1,293 | $60,388 | $13,750 | $46,638 |
| 2021 | $1,270 | $43,488 | $8,750 | $34,738 |
| 2020 | $1,270 | $43,488 | $8,750 | $34,738 |
| 2019 | $1,270 | $43,488 | $8,750 | $34,738 |
| 2018 | $1,218 | $43,488 | $0 | $0 |
| 2017 | $1,025 | $28,775 | $0 | $0 |
| 2016 | $1,025 | $28,775 | $0 | $0 |
| 2015 | $1,025 | $28,775 | $0 | $0 |
| 2014 | $716 | $28,775 | $0 | $0 |
| 2013 | -- | $24,975 | $0 | $0 |
Source: Public Records
Map
Nearby Homes
- 106 Halfrunner Way Unit 4
- 104 Halfrunner Way Unit 3
- 102 Halfrunner Way Unit 2
- 100 Halfrunner Way Unit 1
- 205 Bane Dr
- 203 McNickle Dr
- 201 Bane Dr
- 108 McNickle Dr
- 104 Belaire Dr
- 307 Dartford Ct
- 313 Mayfield Dr
- 203 S Lowry St
- 401 Ravencliff Ct
- 640 Ken Pilkerton Dr
- 702 Mill Springs Dr
- 1547 Repton Rd
- 202 Latimer Dr
- 512 Holston Dr
- 303 Davis Park Dr
- 104 Evanmeade Dr
- 305 Belaire Dr
- 401 Belaire Dr
- 306 Belaire Dr
- 103 Stewarts View Dr
- 303 Belaire Dr
- 400 Belaire Dr
- 0 Joyner Dr
- 102 Stewarts View Dr
- 403 Belaire Dr
- 402 Belaire Dr
- 302 Belaire Dr
- 105 Stewarts View Dr
- 301 Belaire Dr
- 222 McNickle Dr
- 104 Stewarts View Dr
- 404 Belaire Dr
- 405 Belaire Dr
- 220 McNickle Dr
- 106 Stewarts View Dr
- 107 Stewarts View Dr