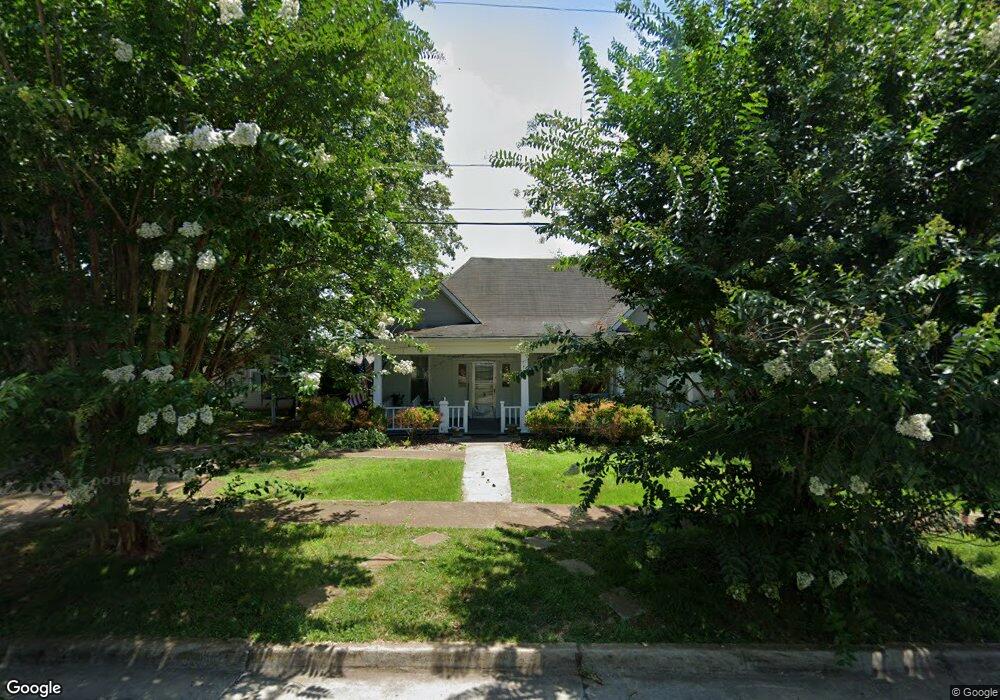
307 Deller St Lawrenceburg, TN 38464
Estimated Value: $179,018 - $229,000
--
Bed
2
Baths
1,553
Sq Ft
$128/Sq Ft
Est. Value
About This Home
This home is located at 307 Deller St, Lawrenceburg, TN 38464 and is currently estimated at $198,505, approximately $127 per square foot. 307 Deller St is a home located in Lawrence County with nearby schools including Ingram Sowell Elementary School, David Crockett Elementary School, and Lawrenceburg Public Elementary School.
Ownership History
Date
Name
Owned For
Owner Type
Purchase Details
Closed on
Aug 25, 2021
Sold by
Markus Robert M and Markus Linda E
Bought by
Dorvil Jean and Dorvil Jennifer
Current Estimated Value
Home Financials for this Owner
Home Financials are based on the most recent Mortgage that was taken out on this home.
Original Mortgage
$96,000
Outstanding Balance
$87,162
Interest Rate
2.8%
Mortgage Type
Purchase Money Mortgage
Estimated Equity
$111,343
Purchase Details
Closed on
Jun 23, 2011
Sold by
Morrow Shirley
Bought by
Markus Robert M and Markus Linda E
Purchase Details
Closed on
Sep 4, 2009
Sold by
Anderson Marjorie M
Bought by
Morrow Shirley
Home Financials for this Owner
Home Financials are based on the most recent Mortgage that was taken out on this home.
Original Mortgage
$10,000
Interest Rate
5.15%
Purchase Details
Closed on
Nov 2, 2000
Bought by
Anderson Jack F and Anderson Marjorie
Purchase Details
Closed on
Oct 26, 1971
Bought by
Mclean Charles Stribling
Create a Home Valuation Report for This Property
The Home Valuation Report is an in-depth analysis detailing your home's value as well as a comparison with similar homes in the area
Home Values in the Area
Average Home Value in this Area
Purchase History
| Date | Buyer | Sale Price | Title Company |
|---|---|---|---|
| Dorvil Jean | $110,000 | None Available | |
| Markus Robert M | $65,000 | -- | |
| Morrow Shirley | $50,000 | -- | |
| Anderson Jack F | $72,000 | -- | |
| Mclean Charles Stribling | -- | -- |
Source: Public Records
Mortgage History
| Date | Status | Borrower | Loan Amount |
|---|---|---|---|
| Open | Dorvil Jean | $96,000 | |
| Previous Owner | Mclean Charles Stribling | $10,000 |
Source: Public Records
Tax History Compared to Growth
Tax History
| Year | Tax Paid | Tax Assessment Tax Assessment Total Assessment is a certain percentage of the fair market value that is determined by local assessors to be the total taxable value of land and additions on the property. | Land | Improvement |
|---|---|---|---|---|
| 2025 | $660 | $21,225 | $0 | $0 |
| 2024 | $660 | $21,225 | $1,750 | $19,475 |
| 2023 | $660 | $21,225 | $1,750 | $19,475 |
| 2022 | $660 | $21,225 | $1,750 | $19,475 |
| 2021 | $578 | $13,150 | $1,750 | $11,400 |
| 2020 | $578 | $13,150 | $1,750 | $11,400 |
| 2019 | $578 | $13,150 | $1,750 | $11,400 |
| 2018 | $578 | $13,150 | $1,750 | $11,400 |
| 2017 | $578 | $13,150 | $1,750 | $11,400 |
| 2016 | $578 | $13,150 | $1,750 | $11,400 |
| 2015 | $547 | $13,150 | $1,750 | $11,400 |
| 2014 | $519 | $12,475 | $1,750 | $10,725 |
Source: Public Records
Map
Nearby Homes
- 108 Buffalo Rd
- 222 Groh St
- 219 Waterloo St
- 409 N Military Ave
- 113 W Taylor St
- 209 Frank St
- 0 Woodland Dr Unit RTC2772580
- 215 Depot St
- 213 Pulaski St
- 426 Frank St
- 316 S Military Ave
- 802 Mahr Ave
- 310 May St
- 806 Fair Ave
- 0 Stewart St
- 511 S Locust Ave
- 815 1st Ave
- 220 Jackson Ave
- 405 6th St
- 220 Lafayette Ave