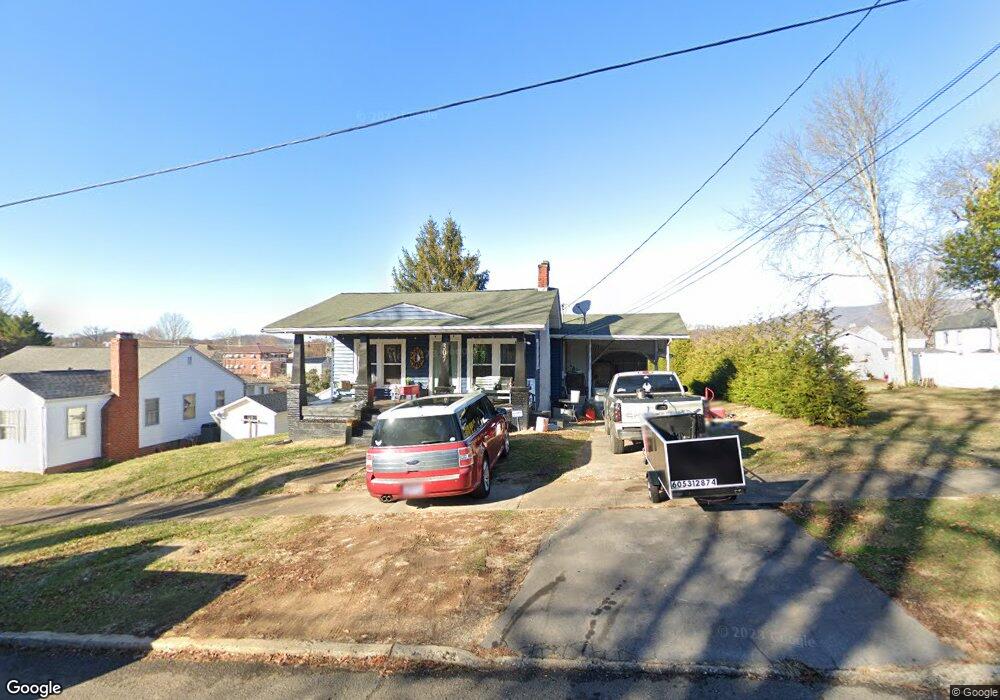
307 E I St Elizabethton, TN 37643
Estimated Value: $147,000 - $212,935
--
Bed
1
Bath
1,156
Sq Ft
$160/Sq Ft
Est. Value
About This Home
This home is located at 307 E I St, Elizabethton, TN 37643 and is currently estimated at $185,484, approximately $160 per square foot. 307 E I St is a home located in Carter County with nearby schools including Elizabethton High School and East Tn Christian Home & Academy.
Ownership History
Date
Name
Owned For
Owner Type
Purchase Details
Closed on
May 9, 2016
Sold by
Williams Jerilyn E
Bought by
Kelley John M and Kelley Sheila S
Current Estimated Value
Home Financials for this Owner
Home Financials are based on the most recent Mortgage that was taken out on this home.
Original Mortgage
$30,000
Outstanding Balance
$18,627
Interest Rate
3.59%
Mortgage Type
New Conventional
Estimated Equity
$166,857
Purchase Details
Closed on
Mar 9, 2016
Sold by
Tolley Jerilyn and Tolley Jamie
Bought by
Tolley Jerilyn E
Purchase Details
Closed on
Mar 9, 2010
Sold by
Tolley Jamie A
Bought by
Tolley Jerilyn E
Purchase Details
Closed on
Jul 15, 2002
Sold by
Porter Brenda
Bought by
Tolley Jamie A
Home Financials for this Owner
Home Financials are based on the most recent Mortgage that was taken out on this home.
Original Mortgage
$68,359
Interest Rate
6.67%
Purchase Details
Closed on
Nov 25, 1998
Bought by
Hoss Carmaleta
Purchase Details
Closed on
Mar 14, 1995
Sold by
Greenwell Earnest
Bought by
Walker Roy
Purchase Details
Closed on
Dec 31, 1987
Bought by
Greenwell Earnest Frances D
Purchase Details
Closed on
Jun 6, 1964
Bought by
Nave Lloyd E and Nave Selma E
Create a Home Valuation Report for This Property
The Home Valuation Report is an in-depth analysis detailing your home's value as well as a comparison with similar homes in the area
Home Values in the Area
Average Home Value in this Area
Purchase History
| Date | Buyer | Sale Price | Title Company |
|---|---|---|---|
| Kelley John M | $62,000 | -- | |
| Tolley Jerilyn E | -- | -- | |
| Tolley Jerilyn E | -- | -- | |
| Tolley Jamie A | $68,900 | -- | |
| Hoss Carmaleta | $59,000 | -- | |
| Walker Roy | $38,000 | -- | |
| Greenwell Earnest Frances D | $25,000 | -- | |
| Nave Lloyd E | -- | -- |
Source: Public Records
Mortgage History
| Date | Status | Borrower | Loan Amount |
|---|---|---|---|
| Open | Kelley John M | $30,000 | |
| Previous Owner | Nave Lloyd E | $68,359 |
Source: Public Records
Tax History Compared to Growth
Tax History
| Year | Tax Paid | Tax Assessment Tax Assessment Total Assessment is a certain percentage of the fair market value that is determined by local assessors to be the total taxable value of land and additions on the property. | Land | Improvement |
|---|---|---|---|---|
| 2024 | $938 | $28,400 | $6,500 | $21,900 |
| 2023 | $938 | $28,400 | $0 | $0 |
| 2022 | $1,023 | $28,400 | $6,500 | $21,900 |
| 2021 | $577 | $28,400 | $6,500 | $21,900 |
| 2020 | $899 | $28,400 | $6,500 | $21,900 |
| 2019 | $899 | $20,800 | $3,400 | $17,400 |
| 2018 | $886 | $20,800 | $3,400 | $17,400 |
| 2017 | $859 | $20,800 | $3,400 | $17,400 |
| 2016 | $855 | $20,150 | $3,400 | $16,750 |
| 2015 | $856 | $20,150 | $3,400 | $16,750 |
| 2014 | $855 | $20,025 | $3,400 | $16,625 |
Source: Public Records
Map
Nearby Homes