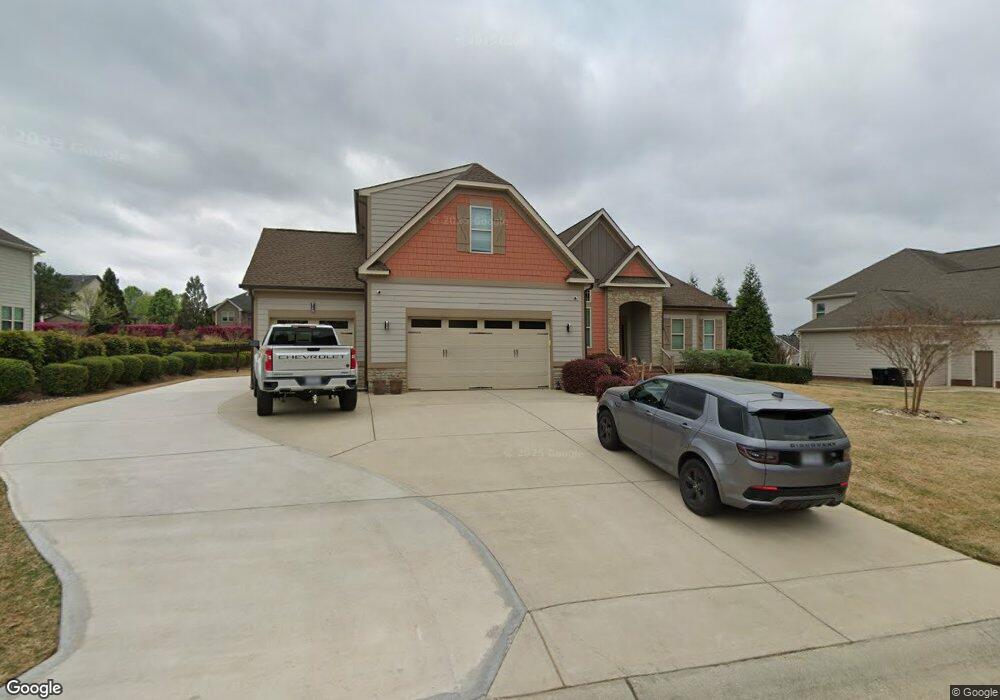
307 Fieldtrial Cir Garner, NC 27529
Cleveland NeighborhoodEstimated Value: $509,713 - $559,000
4
Beds
3
Baths
2,850
Sq Ft
$187/Sq Ft
Est. Value
About This Home
This home is located at 307 Fieldtrial Cir, Garner, NC 27529 and is currently estimated at $533,678, approximately $187 per square foot. 307 Fieldtrial Cir is a home located in Johnston County with nearby schools including West View Elementary School, Cleveland Middle School, and West Johnston High School.
Ownership History
Date
Name
Owned For
Owner Type
Purchase Details
Closed on
Jun 16, 2017
Sold by
Bollen David and Sanchez Melanie
Bought by
The Judy B Schunk Living Trust
Current Estimated Value
Home Financials for this Owner
Home Financials are based on the most recent Mortgage that was taken out on this home.
Original Mortgage
$246,400
Outstanding Balance
$204,953
Interest Rate
4.02%
Mortgage Type
New Conventional
Estimated Equity
$328,725
Purchase Details
Closed on
Aug 13, 2014
Sold by
Bollen David
Bought by
Bollen David and Sanchez Melanie
Home Financials for this Owner
Home Financials are based on the most recent Mortgage that was taken out on this home.
Original Mortgage
$285,425
Interest Rate
4.2%
Mortgage Type
New Conventional
Purchase Details
Closed on
Oct 10, 2013
Sold by
Dj 4042 Inc
Bought by
Golden Properties & Development Inc
Create a Home Valuation Report for This Property
The Home Valuation Report is an in-depth analysis detailing your home's value as well as a comparison with similar homes in the area
Home Values in the Area
Average Home Value in this Area
Purchase History
| Date | Buyer | Sale Price | Title Company |
|---|---|---|---|
| The Judy B Schunk Living Trust | $308,000 | None Available | |
| Bollen David | -- | None Available | |
| Bollen David I | $280,000 | None Available | |
| Golden Properties & Development Inc | $53,000 | None Available |
Source: Public Records
Mortgage History
| Date | Status | Borrower | Loan Amount |
|---|---|---|---|
| Open | The Judy B Schunk Living Trust | $246,400 | |
| Previous Owner | Bollen David I | $285,425 |
Source: Public Records
Tax History Compared to Growth
Tax History
| Year | Tax Paid | Tax Assessment Tax Assessment Total Assessment is a certain percentage of the fair market value that is determined by local assessors to be the total taxable value of land and additions on the property. | Land | Improvement |
|---|---|---|---|---|
| 2025 | $3,302 | $520,060 | $75,000 | $445,060 |
| 2024 | $2,776 | $342,720 | $50,000 | $292,720 |
| 2023 | $2,682 | $342,720 | $50,000 | $292,720 |
| 2022 | $2,819 | $342,720 | $50,000 | $292,720 |
| 2021 | $2,819 | $342,720 | $50,000 | $292,720 |
| 2020 | $2,853 | $342,720 | $50,000 | $292,720 |
| 2019 | $2,853 | $342,720 | $50,000 | $292,720 |
| 2018 | $2,645 | $310,320 | $50,000 | $260,320 |
| 2017 | $2,645 | $310,320 | $50,000 | $260,320 |
| 2016 | $2,645 | $310,320 | $50,000 | $260,320 |
| 2015 | -- | $310,320 | $50,000 | $260,320 |
| 2014 | -- | $71,050 | $50,000 | $21,050 |
Source: Public Records
Map
Nearby Homes
- 413 Fieldtrial Cir
- 325 Airedale Trail
- 115 Unique Place
- 394 Airedale Trail
- 39 Beau Dr
- 181 Fawn Hill Ct
- 75 Fawn Hill Ct
- 36 Labradoodle Ct
- 146 Shadowbark Dr
- 1092 Adams Point Dr
- 58 Larkwood Ln
- 113 Hogan Dr
- 48 Banbury Ct
- Roanoke Plan at Brant Station
- Fontana Plan at Brant Station
- Avenel II Plan at Brant Station
- 1152 Black Angus Dr
- 1037 Olive Dr
- 165 Rynal Dr
- 111 Artic Cir
- 331 Fieldtrial Cir
- 285 Fieldtrial Cir
- 322 Fieldtrial Cir
- 304 Fieldtrial Cir
- 160 Meadowmist Dr
- 347 Fieldtrial Cir
- 347 Fieldtrial Cir Unit Kims3
- 142 Meadowmist Dr
- 176 Meadowmist Dr
- 259 Fieldtrial Cir
- 284 Fieldtrial Cir Unit CARS3
- 336 Fieldtrial Cir
- 336 Fieldtrial Cir Unit Carol
- 194 Meadowmist Dr
- 34 Suntree Ln
- 268 Fieldtrial Cir
- 367 Fieldtrial Cir
- 356 Fieldtrial Cir
- 250 Fieldtrial Cir
- 167 Meadowmist Dr