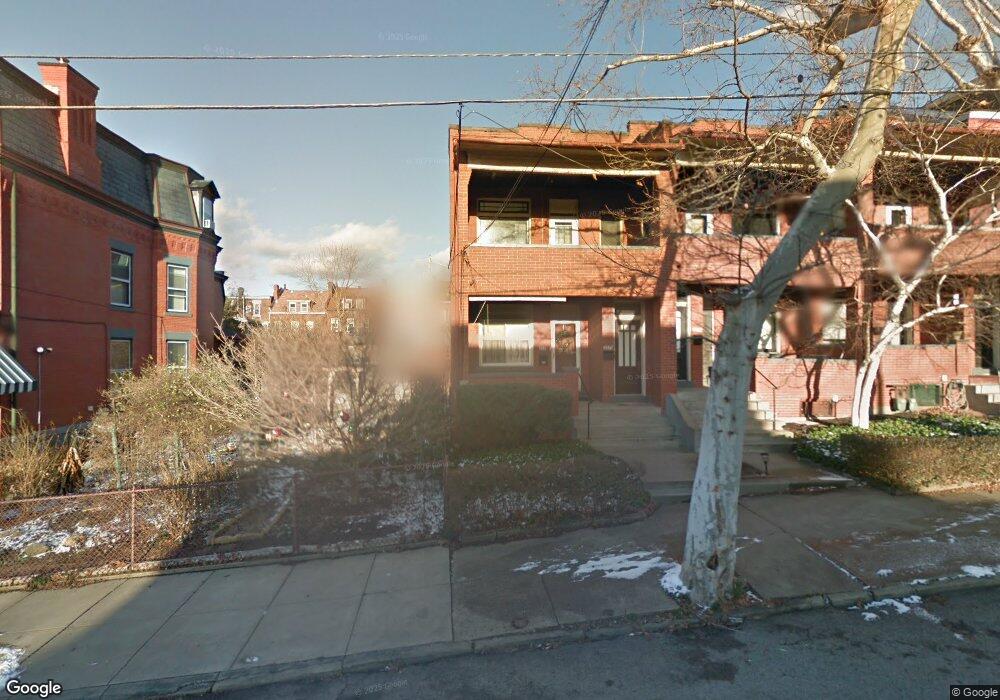
307 Fisk St Pittsburgh, PA 15201
Central Lawrenceville NeighborhoodEstimated Value: $533,598 - $634,000
2
Beds
1
Bath
2,376
Sq Ft
$239/Sq Ft
Est. Value
About This Home
This home is located at 307 Fisk St, Pittsburgh, PA 15201 and is currently estimated at $568,400, approximately $239 per square foot. 307 Fisk St is a home located in Allegheny County with nearby schools including Pittsburgh Arsenal K-5, Pittsburgh Arsenal 6-8, and Pittsburgh Milliones 6-12.
Ownership History
Date
Name
Owned For
Owner Type
Purchase Details
Closed on
Nov 29, 2017
Sold by
Crisafio Anthony J
Bought by
Bashley Investments 1 Llc A Pennsylvania
Current Estimated Value
Home Financials for this Owner
Home Financials are based on the most recent Mortgage that was taken out on this home.
Original Mortgage
$350,000
Outstanding Balance
$294,211
Interest Rate
3.88%
Mortgage Type
New Conventional
Estimated Equity
$274,189
Create a Home Valuation Report for This Property
The Home Valuation Report is an in-depth analysis detailing your home's value as well as a comparison with similar homes in the area
Home Values in the Area
Average Home Value in this Area
Purchase History
| Date | Buyer | Sale Price | Title Company |
|---|---|---|---|
| Bashley Investments 1 Llc A Pennsylvania | $365,000 | None Available |
Source: Public Records
Mortgage History
| Date | Status | Borrower | Loan Amount |
|---|---|---|---|
| Open | Bashley Investments 1 Llc A Pennsylvania | $350,000 |
Source: Public Records
Tax History Compared to Growth
Tax History
| Year | Tax Paid | Tax Assessment Tax Assessment Total Assessment is a certain percentage of the fair market value that is determined by local assessors to be the total taxable value of land and additions on the property. | Land | Improvement |
|---|---|---|---|---|
| 2025 | $4,447 | $193,000 | $35,300 | $157,700 |
| 2024 | $4,447 | $193,000 | $35,300 | $157,700 |
| 2023 | $4,447 | $193,000 | $35,300 | $157,700 |
| 2022 | $4,389 | $193,000 | $35,300 | $157,700 |
| 2021 | $4,437 | $193,000 | $35,300 | $157,700 |
| 2020 | $4,368 | $193,000 | $35,300 | $157,700 |
| 2019 | $4,368 | $193,000 | $35,300 | $157,700 |
| 2018 | $3,503 | $193,000 | $35,300 | $157,700 |
| 2017 | $4,368 | $193,000 | $35,300 | $157,700 |
| 2016 | $557 | $117,700 | $35,300 | $82,400 |
| 2015 | $557 | $117,700 | $35,300 | $82,400 |
| 2014 | $2,605 | $117,700 | $35,300 | $82,400 |
Source: Public Records
Map
Nearby Homes