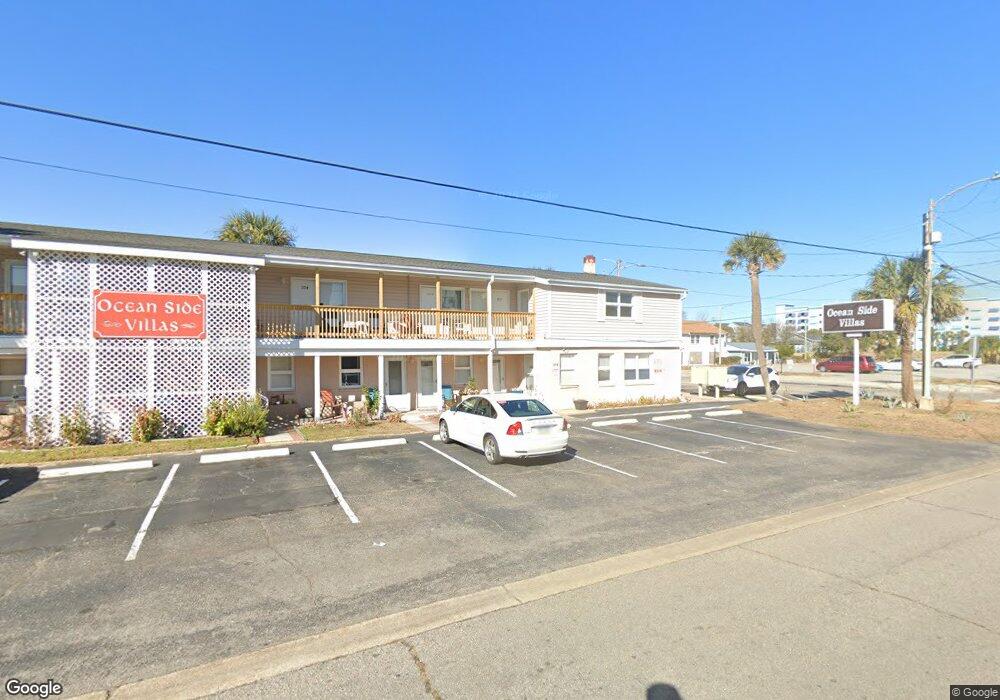
307 Flagg St Unit 303 Myrtle Beach, SC 29577
Downtown Myrtle Beach NeighborhoodEstimated Value: $77,946 - $121,000
1
Bed
1
Bath
560
Sq Ft
$180/Sq Ft
Est. Value
About This Home
This home is located at 307 Flagg St Unit 303, Myrtle Beach, SC 29577 and is currently estimated at $100,982, approximately $180 per square foot. 307 Flagg St Unit 303 is a home located in Horry County with nearby schools including Myrtle Beach Child Development Center, Myrtle Beach Primary School, and Myrtle Beach Elementary School.
Ownership History
Date
Name
Owned For
Owner Type
Purchase Details
Closed on
Jan 1, 2024
Sold by
Inman Kevin
Bought by
Inman Kevin and Inman Jennifer
Current Estimated Value
Purchase Details
Closed on
Nov 16, 2021
Sold by
Childers Rick
Bought by
Dison Kelly C and Childers Michelle L
Purchase Details
Closed on
Sep 2, 2020
Sold by
Barnette Leslie H
Bought by
Honeycutt Jason Douglas Tr and Barnette Family Trust
Purchase Details
Closed on
Jun 5, 2018
Sold by
Widener Darrin W
Bought by
Soto Donna
Purchase Details
Closed on
Apr 28, 2015
Sold by
Sipe Tracey M
Bought by
Calloway Charles L
Purchase Details
Closed on
Oct 26, 2012
Sold by
Campbell Gregory N
Bought by
Inman Kevin G
Purchase Details
Closed on
Apr 16, 2008
Sold by
Campbell Gregory N
Bought by
Adams Steve C
Purchase Details
Closed on
Mar 30, 2005
Sold by
Campbell Gregory N and Sipe Charles W
Bought by
Sipe Tracey M and Harvell Jackie
Purchase Details
Closed on
Dec 17, 2001
Sold by
Digiulio Diane
Bought by
Campbell Gregory N and Sipe Charles W
Purchase Details
Closed on
Jul 27, 2000
Sold by
Shrank Larry
Bought by
Digiulio Diane
Create a Home Valuation Report for This Property
The Home Valuation Report is an in-depth analysis detailing your home's value as well as a comparison with similar homes in the area
Home Values in the Area
Average Home Value in this Area
Purchase History
| Date | Buyer | Sale Price | Title Company |
|---|---|---|---|
| Inman Kevin | -- | -- | |
| Inman Kevin G | -- | -- | |
| Inman Kevin | $8,500 | -- | |
| Inman Kevin | -- | -- | |
| Dison Kelly C | -- | -- | |
| Honeycutt Jason Douglas Tr | -- | -- | |
| Soto Donna | $8,000 | -- | |
| Calloway Charles L | $6,000 | -- | |
| Inman Kevin | $6,000 | -- | |
| Inman Kevin G | $5,000 | -- | |
| Adams Steve C | $5,000 | -- | |
| Sipe Tracey M | $32,800 | -- | |
| Campbell Gregory N | $23,000 | -- | |
| Digiulio Diane | -- | -- |
Source: Public Records
Tax History Compared to Growth
Tax History
| Year | Tax Paid | Tax Assessment Tax Assessment Total Assessment is a certain percentage of the fair market value that is determined by local assessors to be the total taxable value of land and additions on the property. | Land | Improvement |
|---|---|---|---|---|
| 2024 | $1,191 | $4,500 | $0 | $4,500 |
| 2023 | $1,119 | $5,775 | $0 | $5,775 |
| 2021 | $1,031 | $5,775 | $0 | $5,775 |
| 2020 | $850 | $5,775 | $0 | $5,775 |
| 2019 | $850 | $5,775 | $0 | $5,775 |
| 2018 | $447 | $2,940 | $0 | $2,940 |
| 2017 | $442 | $1,680 | $0 | $1,680 |
| 2016 | $0 | $1,680 | $0 | $1,680 |
| 2015 | -- | $2,940 | $0 | $2,940 |
| 2014 | $425 | $1,680 | $0 | $1,680 |
Source: Public Records
Map
Nearby Homes
- 307 Flagg St Unit 105
- 307 Flagg St Unit 205
- 307 Flagg St Unit s 103 104 105 10
- 307 Flagg St Unit 103
- 301 N Ocean Blvd
- 311 3rd Ave N
- 2312 Seaseeker Ln Unit Lot 11
- 2312 Seaseeker Ln
- 2308 Seaseeker Ln
- 2310 Seaseeker Ln
- 1410 Lancaster Way Unit Lot 198, Ph. 2A, "Ea
- 308 2nd Ave N
- 504 N Ocean Blvd Unit 1803
- 504 N Ocean Blvd Unit 1502 Bay View Resort
- 504 N Ocean Blvd Unit 701
- 504 N Ocean Blvd Unit 310
- 504 N Ocean Blvd Unit 1202
- 504 N Ocean Blvd Unit 1611
- 504 N Ocean Blvd Unit 309
- 504 N Ocean Blvd Unit 210
- 307 Flagg St Unit Ocean Side Villas-6
- 307 Flagg St
- 307 Flagg St
- 307 Flagg St Unit 108
- 307 Flagg St Unit 306
- 307 Flagg St Unit 305
- 307 Flagg St Unit 304
- 307 Flagg St Unit 302
- 307 Flagg St Unit 301
- 307 Flagg St Unit 208
- 307 Flagg St Unit 207
- 307 Flagg St Unit 206
- 307 Flagg St Unit 204
- 307 Flagg St Unit 203
- 307 Flagg St Unit 202
- 307 Flagg St Unit 201
- 307 Flagg St Unit 102
- 307 Flagg St Unit 101
- 307 Flagg St Unit 101 & 100
- 307 4th Ave N