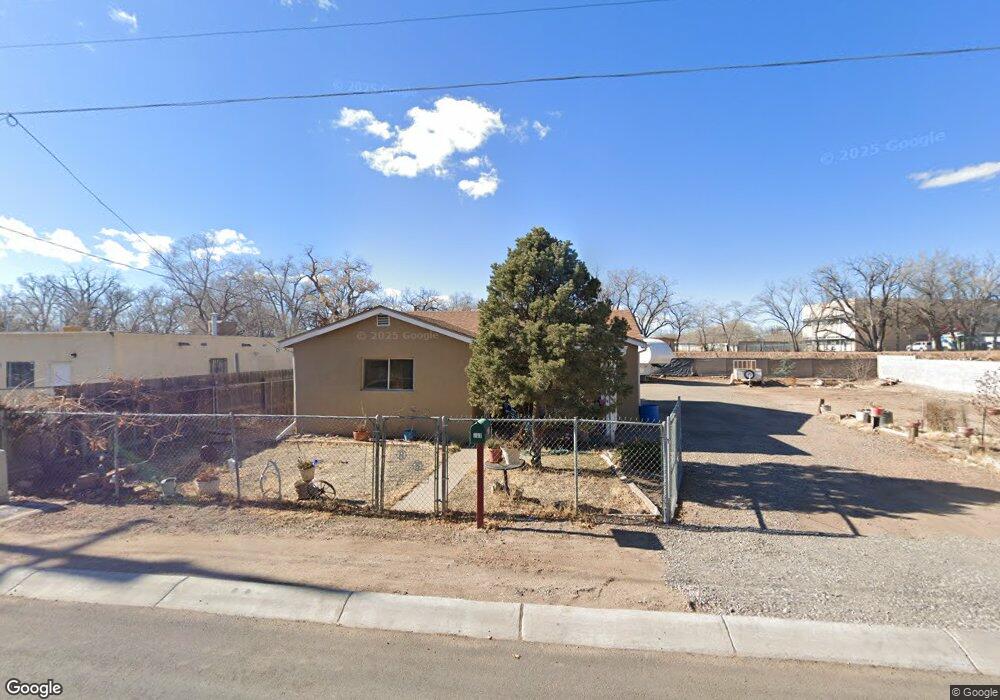
307 Greenwich Rd SW Albuquerque, NM 87105
Estimated Value: $188,000 - $249,000
2
Beds
1
Bath
1,138
Sq Ft
$193/Sq Ft
Est. Value
About This Home
This home is located at 307 Greenwich Rd SW, Albuquerque, NM 87105 and is currently estimated at $219,879, approximately $193 per square foot. 307 Greenwich Rd SW is a home located in Bernalillo County with nearby schools including Armijo Elementary School, Ernie Pyle Middle School, and Rio Grande High School.
Ownership History
Date
Name
Owned For
Owner Type
Purchase Details
Closed on
Dec 5, 2018
Sold by
Serna Pacheco Georgina and Pacheco Anthony
Bought by
Serna Pacheco Georgina and Pacheco Anthony
Current Estimated Value
Home Financials for this Owner
Home Financials are based on the most recent Mortgage that was taken out on this home.
Original Mortgage
$99,950
Outstanding Balance
$87,886
Interest Rate
4.8%
Mortgage Type
New Conventional
Estimated Equity
$131,993
Purchase Details
Closed on
Oct 26, 2018
Sold by
Pvc Co
Bought by
Serna Pacheco Georgina
Home Financials for this Owner
Home Financials are based on the most recent Mortgage that was taken out on this home.
Original Mortgage
$99,950
Outstanding Balance
$87,886
Interest Rate
4.8%
Mortgage Type
New Conventional
Estimated Equity
$131,993
Purchase Details
Closed on
Dec 20, 2010
Sold by
Telles Ruth Serna and Pacheco Georgina Serna
Bought by
Pvc Company
Purchase Details
Closed on
Dec 26, 2002
Sold by
Cable Celia A
Bought by
Telles Ruth Serna and Pacheco Georgina Serna
Create a Home Valuation Report for This Property
The Home Valuation Report is an in-depth analysis detailing your home's value as well as a comparison with similar homes in the area
Home Values in the Area
Average Home Value in this Area
Purchase History
| Date | Buyer | Sale Price | Title Company |
|---|---|---|---|
| Serna Pacheco Georgina | -- | Stewart Title | |
| Serna Pacheco Georgina | -- | None Available | |
| Pvc Company | -- | None Available | |
| Telles Ruth Serna | -- | -- |
Source: Public Records
Mortgage History
| Date | Status | Borrower | Loan Amount |
|---|---|---|---|
| Open | Serna Pacheco Georgina | $99,950 |
Source: Public Records
Tax History Compared to Growth
Tax History
| Year | Tax Paid | Tax Assessment Tax Assessment Total Assessment is a certain percentage of the fair market value that is determined by local assessors to be the total taxable value of land and additions on the property. | Land | Improvement |
|---|---|---|---|---|
| 2025 | $1,283 | $37,671 | $17,464 | $20,207 |
| 2024 | $1,283 | $36,574 | $16,955 | $19,619 |
| 2023 | $1,258 | $35,510 | $16,462 | $19,048 |
| 2022 | $1,182 | $34,475 | $15,982 | $18,493 |
| 2021 | $1,141 | $33,472 | $15,517 | $17,955 |
| 2020 | $1,118 | $32,497 | $15,065 | $17,432 |
| 2019 | $1,121 | $32,563 | $15,065 | $17,498 |
| 2018 | $1,010 | $32,563 | $15,065 | $17,498 |
| 2017 | $973 | $27,721 | $15,982 | $11,739 |
| 2016 | $936 | $26,131 | $15,065 | $11,066 |
| 2015 | $25,840 | $25,840 | $10,032 | $15,808 |
| 2014 | $882 | $25,087 | $9,740 | $15,347 |
| 2013 | -- | $24,357 | $9,456 | $14,901 |
Source: Public Records
Map
Nearby Homes
- 308 La Vega Dr SW
- 1109 Lovato Rd SW
- 121 La Vega Dr SW
- 1347 Young Ave SW
- 835 Armijo Rd SW
- 1545 Feliz Ln SW
- 822 Lewis Ave SW
- 1233 Montrose Place SW
- 1567 Las Glorietas SW
- 1116 Isleta Blvd SW
- 711 Lewis Ave SW
- 923 Pacific Ave SW
- 710 Cromwell Ave SW
- 121 Hosher Ave SE
- 2014 William St SE
- 1816 San Ygnacio Rd SW
- 2007 Hinkle St SE
- 1816 Wildwood Ln SW
- 1319 La Vega Dr SW
- 2024 Hinkle St SE
- 309 Greenwich Rd SW
- 305 Greenwich Rd SW
- 306 Greenwich Rd SW
- 308 Greenwich Rd SW
- 311 Greenwich Rd SW
- 304 Greenwich Rd SW
- 341 Greenwich Rd SW
- 310 Greenwich Rd SW
- 301 Greenwich Rd SW
- 300 Greenwich Rd SW
- 312 Greenwich Rd SW
- 298 Greenwich Rd SW
- 345 Greenwich Rd SW
- 416 Isleta Blvd SW
- 416 Isleta Blvd SW
- 311 La Vega Dr SW
- 328 Greenwich Rd SW
- 323 La Vega Dr SW
- 327 La Vega Dr SW
- 333 La Vega Dr SW