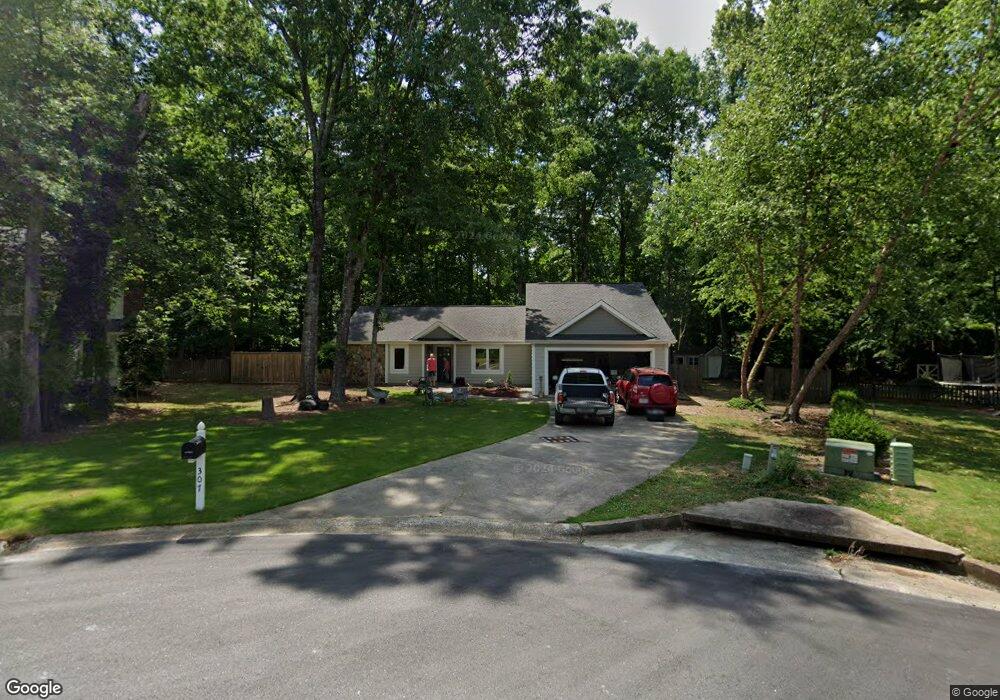
307 Henley Way Unit 33 Peachtree City, GA 30269
Estimated Value: $418,000 - $424,000
3
Beds
2
Baths
1,550
Sq Ft
$271/Sq Ft
Est. Value
About This Home
This home is located at 307 Henley Way Unit 33, Peachtree City, GA 30269 and is currently estimated at $420,474, approximately $271 per square foot. 307 Henley Way Unit 33 is a home located in Fayette County with nearby schools including Peeples Elementary School, Rising Starr Middle School, and Starrs Mill High School.
Ownership History
Date
Name
Owned For
Owner Type
Purchase Details
Closed on
Oct 20, 2017
Sold by
Highgrove Holdings Llc
Bought by
Brown Kenneth Vincent and Boldt Brown Daphne
Current Estimated Value
Home Financials for this Owner
Home Financials are based on the most recent Mortgage that was taken out on this home.
Original Mortgage
$105,000
Outstanding Balance
$57,077
Interest Rate
3.83%
Mortgage Type
New Conventional
Estimated Equity
$363,397
Purchase Details
Closed on
Feb 14, 2017
Sold by
Lsf9 Master Participat Trust
Bought by
Gardiner Michael D
Purchase Details
Closed on
Dec 6, 2016
Sold by
Smith Johnny B
Bought by
Us Bank Trust Na Trustee
Purchase Details
Closed on
Apr 1, 1999
Sold by
Brown Robert W and Brown Andrea K
Bought by
Smith Catherine B and Smith Johnny
Home Financials for this Owner
Home Financials are based on the most recent Mortgage that was taken out on this home.
Original Mortgage
$127,500
Interest Rate
7.06%
Mortgage Type
New Conventional
Create a Home Valuation Report for This Property
The Home Valuation Report is an in-depth analysis detailing your home's value as well as a comparison with similar homes in the area
Home Values in the Area
Average Home Value in this Area
Purchase History
| Date | Buyer | Sale Price | Title Company |
|---|---|---|---|
| Brown Kenneth Vincent | $255,000 | -- | |
| Gardiner Michael D | $151,000 | -- | |
| Highgrove Holdings Llc | -- | -- | |
| Us Bank Trust Na Trustee | $200,000 | -- | |
| Smith Catherine B | $141,800 | -- |
Source: Public Records
Mortgage History
| Date | Status | Borrower | Loan Amount |
|---|---|---|---|
| Open | Brown Kenneth Vincent | $105,000 | |
| Previous Owner | Smith Catherine B | $127,500 |
Source: Public Records
Tax History Compared to Growth
Tax History
| Year | Tax Paid | Tax Assessment Tax Assessment Total Assessment is a certain percentage of the fair market value that is determined by local assessors to be the total taxable value of land and additions on the property. | Land | Improvement |
|---|---|---|---|---|
| 2024 | $3,366 | $149,876 | $30,400 | $119,476 |
| 2023 | $2,853 | $144,040 | $30,400 | $113,640 |
| 2022 | $3,233 | $135,720 | $30,400 | $105,320 |
| 2021 | $2,976 | $113,320 | $18,400 | $94,920 |
| 2020 | $3,189 | $104,680 | $18,400 | $86,280 |
| 2019 | $2,927 | $95,320 | $18,400 | $76,920 |
| 2018 | $2,946 | $94,420 | $17,100 | $77,320 |
| 2017 | $2,745 | $85,580 | $17,100 | $68,480 |
| 2016 | $2,365 | $72,980 | $17,100 | $55,880 |
| 2015 | $2,234 | $67,980 | $17,100 | $50,880 |
| 2014 | $2,076 | $62,260 | $17,100 | $45,160 |
| 2013 | -- | $60,620 | $0 | $0 |
Source: Public Records
Map
Nearby Homes
- 128 Rubicon Rd
- 418 Holly Brook Ln
- 220 Lavender Oasis
- 224 Felspar Ridge
- 318 Marble Ct
- 105 Kraftwood Park
- 100 Endicott Ridge
- 610 Napier Pass
- 110 Tamerlane
- 155 W Creek Ct
- 312 Evian Way
- 313 Evian Way
- 121 Tamerlane
- 202 Pinnacle Ct
- 423 Holly Grove Church Rd
- 401 Vardon Way
- 1103 Iveydale Ln
- 110 Cohabie Ct
- 502 Whittington Way
- 400 Mulberry Dr
- 307 Henley Way
- 305 Henley Way
- 308 Henley Way
- 626 Ambrose Ln
- 303 Henley Way
- 306 Henley Way
- 205 York Gate
- 304 Henley Way
- 620 Ambrose Ln
- 302 Henley Way
- 301 Henley Way
- 203 York Gate
- 629 Ambrose Ln
- 627 Ambrose Ln
- 625 Ambrose Ln
- 104 Rubicon Rd
- 0 Henley Way Unit 8789313
- 0 Henley Way Unit 8413353
- 0 Henley Way Unit 8157559
- 0 Henley Way Unit 7543716