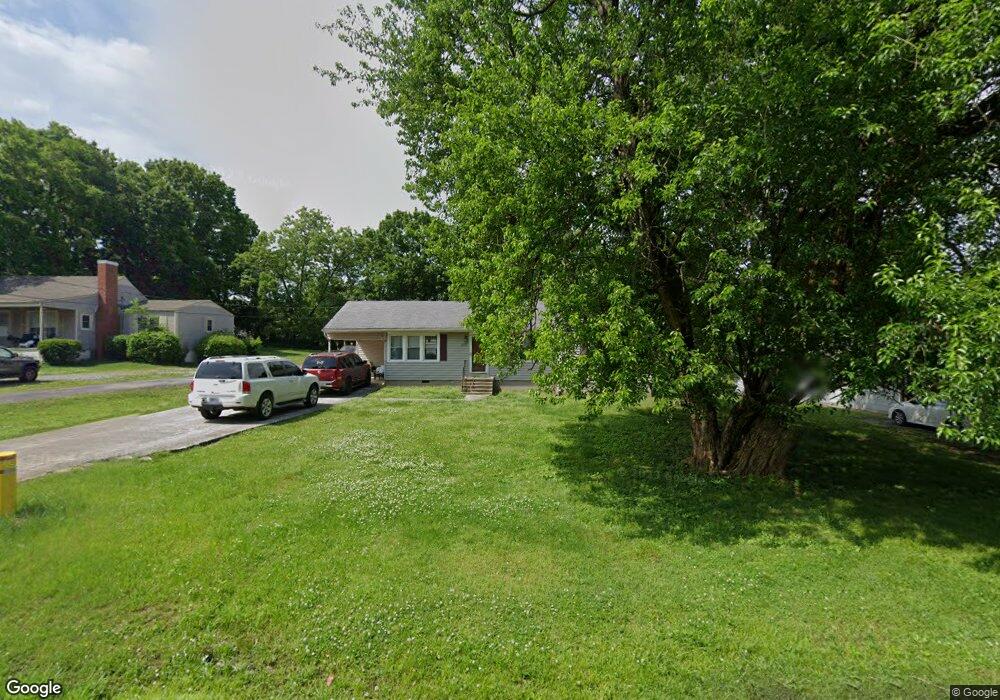
307 Hickory Dr Shelbyville, TN 37160
Estimated Value: $235,000 - $283,000
--
Bed
2
Baths
1,194
Sq Ft
$214/Sq Ft
Est. Value
About This Home
This home is located at 307 Hickory Dr, Shelbyville, TN 37160 and is currently estimated at $255,793, approximately $214 per square foot. 307 Hickory Dr is a home located in Bedford County with nearby schools including Eakin Elementary School, Harris Middle School, and Victory Baptist Academy.
Ownership History
Date
Name
Owned For
Owner Type
Purchase Details
Closed on
Mar 7, 2014
Sold by
Evans Jonathan Thomas
Bought by
Westbrooks Thelma Y and Mcclendon Kenneth
Current Estimated Value
Purchase Details
Closed on
Oct 12, 2012
Sold by
Federal National Mortgage Association
Bought by
Evans Jonathan Thomas
Home Financials for this Owner
Home Financials are based on the most recent Mortgage that was taken out on this home.
Original Mortgage
$76,428
Interest Rate
3.6%
Mortgage Type
Commercial
Purchase Details
Closed on
Jul 24, 2012
Sold by
Bielawski Rita L
Bought by
Federal National Mtg Associati
Purchase Details
Closed on
Jul 25, 2006
Sold by
Overcast Johnny Lyndon
Bought by
Bielawski Rita L
Purchase Details
Closed on
Feb 12, 1991
Bought by
Overcast Johnny Lyndon and Amy Pearce
Purchase Details
Closed on
Nov 4, 1963
Bought by
Ross Claybourne B and Ross Evelyn
Create a Home Valuation Report for This Property
The Home Valuation Report is an in-depth analysis detailing your home's value as well as a comparison with similar homes in the area
Home Values in the Area
Average Home Value in this Area
Purchase History
| Date | Buyer | Sale Price | Title Company |
|---|---|---|---|
| Westbrooks Thelma Y | $80,000 | -- | |
| Evans Jonathan Thomas | $74,900 | -- | |
| Federal National Mtg Associati | $84,497 | -- | |
| Bielawski Rita L | $107,000 | -- | |
| Overcast Johnny Lyndon | $28,000 | -- | |
| Ross Claybourne B | -- | -- |
Source: Public Records
Mortgage History
| Date | Status | Borrower | Loan Amount |
|---|---|---|---|
| Previous Owner | Evans Jonathan Thomas | $76,428 |
Source: Public Records
Tax History Compared to Growth
Tax History
| Year | Tax Paid | Tax Assessment Tax Assessment Total Assessment is a certain percentage of the fair market value that is determined by local assessors to be the total taxable value of land and additions on the property. | Land | Improvement |
|---|---|---|---|---|
| 2025 | -- | $33,950 | $0 | $0 |
| 2024 | -- | $33,950 | $5,400 | $28,550 |
| 2023 | $502 | $33,950 | $5,400 | $28,550 |
| 2022 | $1,329 | $33,950 | $5,400 | $28,550 |
| 2021 | $1,207 | $33,950 | $5,400 | $28,550 |
| 2020 | $1,031 | $33,950 | $5,400 | $28,550 |
| 2019 | $1,031 | $23,275 | $4,000 | $19,275 |
| 2018 | $1,008 | $23,275 | $4,000 | $19,275 |
| 2017 | $1,008 | $23,275 | $4,000 | $19,275 |
| 2016 | $999 | $23,275 | $4,000 | $19,275 |
| 2015 | $999 | $23,275 | $4,000 | $19,275 |
| 2014 | $891 | $22,723 | $0 | $0 |
Source: Public Records
Map
Nearby Homes