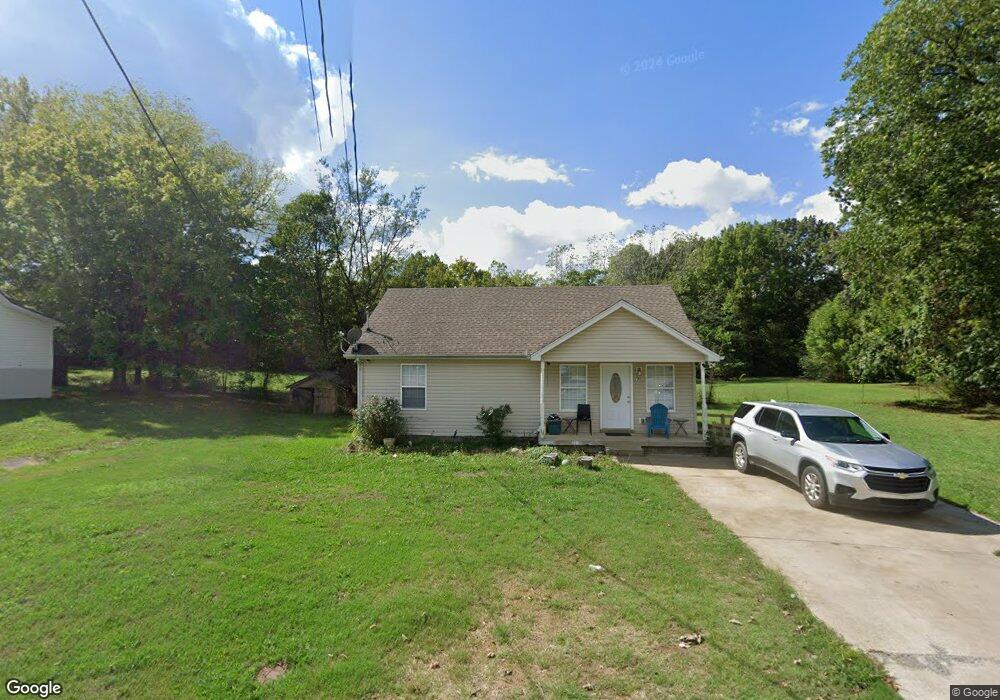
307 N Brown St Springfield, TN 37172
Estimated Value: $207,000 - $246,000
Studio
2
Baths
1,008
Sq Ft
$223/Sq Ft
Est. Value
About This Home
This home is located at 307 N Brown St, Springfield, TN 37172 and is currently estimated at $225,030, approximately $223 per square foot. 307 N Brown St is a home located in Robertson County with nearby schools including Cheatham Park Elementary School, Westside Elementary School, and Innovation Academy.
Ownership History
Date
Name
Owned For
Owner Type
Purchase Details
Closed on
May 5, 2024
Sold by
Rector Joshua H
Bought by
Ibarra Romero Gregorio
Current Estimated Value
Purchase Details
Closed on
Jan 24, 2024
Sold by
Justice John Michael and Justice Deborah K
Bought by
Rector Joshua H
Purchase Details
Closed on
Nov 12, 2009
Sold by
Hjw Builders Llc
Bought by
Justice John Michael
Home Financials for this Owner
Home Financials are based on the most recent Mortgage that was taken out on this home.
Original Mortgage
$88,800
Interest Rate
4.94%
Purchase Details
Closed on
Jul 16, 2008
Sold by
Mike Justice
Bought by
Hjw Builders Llc
Purchase Details
Closed on
Aug 24, 2007
Sold by
Robertson Edward E Etux Ge
Bought by
Mike Justice
Purchase Details
Closed on
Jul 25, 2000
Sold by
Dillaha Elizabeth B
Bought by
Williams Troy L and Williams Marcia R
Purchase Details
Closed on
Oct 15, 1986
Bought by
Robertson Edward E
Create a Home Valuation Report for This Property
The Home Valuation Report is an in-depth analysis detailing your home's value as well as a comparison with similar homes in the area
Home Values in the Area
Average Home Value in this Area
Purchase History
| Date | Buyer | Sale Price | Title Company |
|---|---|---|---|
| Ibarra Romero Gregorio | -- | Warranty Title | |
| Rector Joshua H | $200,000 | Warranty Title | |
| Justice John Michael | $90,017 | -- | |
| Hjw Builders Llc | -- | -- | |
| Mike Justice | $12,000 | -- | |
| Williams Troy L | $30,300 | -- | |
| Robertson Edward E | -- | -- |
Source: Public Records
Mortgage History
| Date | Status | Borrower | Loan Amount |
|---|---|---|---|
| Previous Owner | Robertson Edward E | $88,800 |
Source: Public Records
Tax History
| Year | Tax Paid | Tax Assessment Tax Assessment Total Assessment is a certain percentage of the fair market value that is determined by local assessors to be the total taxable value of land and additions on the property. | Land | Improvement |
|---|---|---|---|---|
| 2025 | -- | $43,975 | $12,500 | $31,475 |
| 2024 | -- | $43,975 | $12,500 | $31,475 |
| 2023 | $1,102 | $43,975 | $12,500 | $31,475 |
| 2022 | $1,062 | $29,125 | $4,825 | $24,300 |
| 2021 | $1,062 | $29,125 | $4,825 | $24,300 |
| 2020 | $1,062 | $29,125 | $4,825 | $24,300 |
| 2019 | $31,950 | $29,125 | $4,825 | $24,300 |
| 2018 | $1,062 | $29,125 | $4,825 | $24,300 |
| 2017 | $986 | $23,000 | $2,450 | $20,550 |
| 2016 | $986 | $23,000 | $2,450 | $20,550 |
| 2015 | $957 | $23,000 | $2,450 | $20,550 |
| 2014 | $957 | $23,000 | $2,450 | $20,550 |
Source: Public Records
Map
Nearby Homes
Your Personal Tour Guide
Ask me questions while you tour the home.