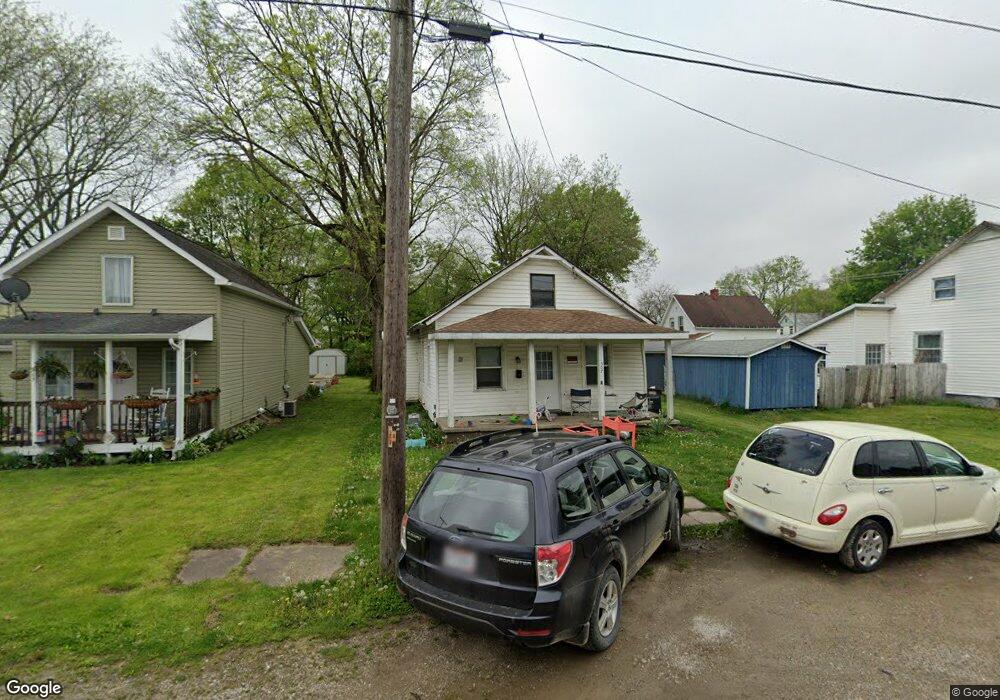
307 N Norton St Mount Vernon, OH 43050
Estimated Value: $99,000 - $160,000
3
Beds
1
Bath
870
Sq Ft
$153/Sq Ft
Est. Value
About This Home
This home is located at 307 N Norton St, Mount Vernon, OH 43050 and is currently estimated at $133,512, approximately $153 per square foot. 307 N Norton St is a home located in Knox County with nearby schools including Mount Vernon High School, St. Vincent de Paul School, and Christian Star Academy.
Ownership History
Date
Name
Owned For
Owner Type
Purchase Details
Closed on
Sep 4, 2019
Sold by
Salyers Vera J
Bought by
Nwb Properties Llc
Current Estimated Value
Home Financials for this Owner
Home Financials are based on the most recent Mortgage that was taken out on this home.
Interest Rate
3.58%
Purchase Details
Closed on
Sep 22, 2016
Sold by
Cennamo Thomas G and Cennamo Vera J
Bought by
Salyers Vera J
Purchase Details
Closed on
May 24, 2010
Sold by
The Mary E Hall Living Trust and Hall Mary E
Bought by
Cennamo Thomas G and Cennamo Vera J
Purchase Details
Closed on
Oct 31, 2001
Sold by
Hall Mary E
Bought by
Hall Mary E Trustee Of Ma
Purchase Details
Closed on
Mar 1, 2001
Sold by
Hall Mary E
Bought by
Hall Mary E
Purchase Details
Closed on
Mar 18, 1999
Sold by
Hall Alva and Hall Mary E
Bought by
Hall Mary E
Create a Home Valuation Report for This Property
The Home Valuation Report is an in-depth analysis detailing your home's value as well as a comparison with similar homes in the area
Home Values in the Area
Average Home Value in this Area
Purchase History
| Date | Buyer | Sale Price | Title Company |
|---|---|---|---|
| Nwb Properties Llc | $370,000 | -- | |
| Salyers Vera J | -- | None Available | |
| Cennamo Thomas G | $7,500 | None Available | |
| Hall Mary E Trustee Of Ma | -- | -- | |
| Hall Mary E | -- | -- | |
| Hall Mary E | -- | -- |
Source: Public Records
Mortgage History
| Date | Status | Borrower | Loan Amount |
|---|---|---|---|
| Closed | Nwb Properties Llc | -- |
Source: Public Records
Tax History Compared to Growth
Tax History
| Year | Tax Paid | Tax Assessment Tax Assessment Total Assessment is a certain percentage of the fair market value that is determined by local assessors to be the total taxable value of land and additions on the property. | Land | Improvement |
|---|---|---|---|---|
| 2024 | $563 | $14,240 | $5,960 | $8,280 |
| 2023 | $563 | $14,240 | $5,960 | $8,280 |
| 2022 | $425 | $9,820 | $4,110 | $5,710 |
| 2021 | $425 | $9,820 | $4,110 | $5,710 |
| 2020 | $414 | $9,820 | $4,110 | $5,710 |
| 2019 | $500 | $10,920 | $5,330 | $5,590 |
| 2018 | $501 | $10,920 | $5,330 | $5,590 |
| 2017 | $518 | $10,920 | $5,330 | $5,590 |
| 2016 | $529 | $10,120 | $4,940 | $5,180 |
| 2015 | $460 | $10,120 | $4,940 | $5,180 |
| 2014 | $462 | $10,120 | $4,940 | $5,180 |
| 2013 | $465 | $9,590 | $4,640 | $4,950 |
Source: Public Records
Map
Nearby Homes
- 302 W Pleasant St
- 304 W Pleasant St
- 305 N Norton St
- 309 N Norton St
- 303 N Norton St
- 301 N Norton St
- 1 Marion St
- 303 W Pleasant St
- 503 W Burgess St
- 3 Marion St
- 307 W Burgess St
- 308 N Norton St
- 306 N Norton St
- 310 N Norton St
- 310 W Pleasant St
- 315 N Norton St
- 5 Marion St
- 305 W Burgess St
- 305 W Burgess St
- 7 Marion St