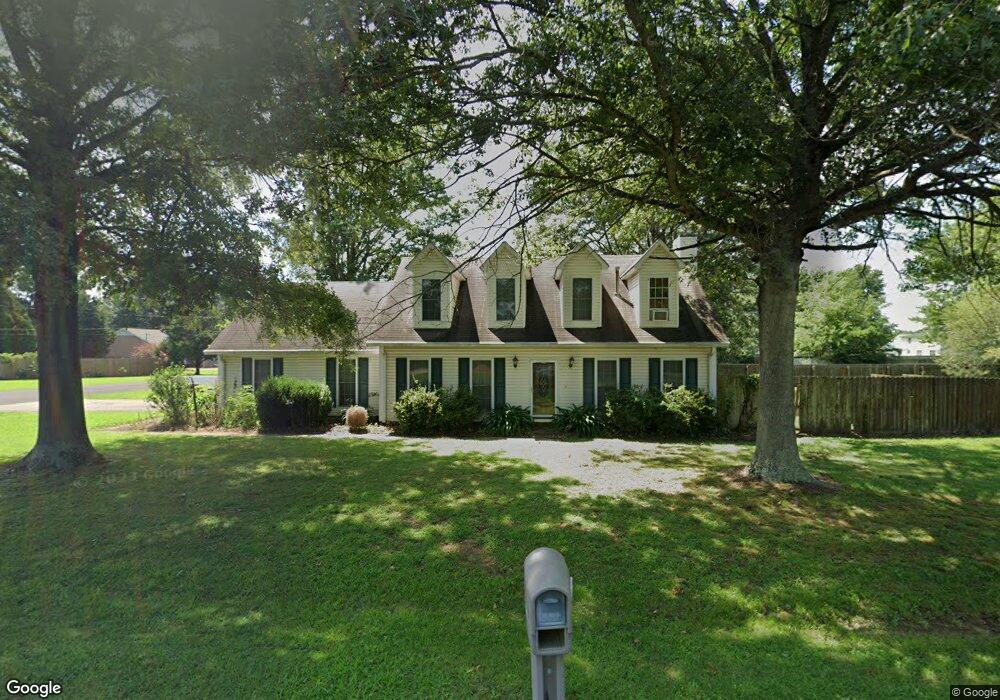
307 Parker Dr Jackson, TN 38305
Estimated Value: $232,775 - $281,000
3
Beds
3
Baths
2,072
Sq Ft
$126/Sq Ft
Est. Value
About This Home
This home is located at 307 Parker Dr, Jackson, TN 38305 and is currently estimated at $261,944, approximately $126 per square foot. 307 Parker Dr is a home located in Madison County with nearby schools including Thelma Barker Elementary School, Northeast Middle School, and North Side High School.
Ownership History
Date
Name
Owned For
Owner Type
Purchase Details
Closed on
Oct 31, 2011
Sold by
Browning Brandon
Bought by
Crossnoe Candace
Current Estimated Value
Home Financials for this Owner
Home Financials are based on the most recent Mortgage that was taken out on this home.
Original Mortgage
$124,755
Outstanding Balance
$83,005
Interest Rate
3.75%
Mortgage Type
FHA
Estimated Equity
$178,939
Purchase Details
Closed on
Oct 16, 2003
Sold by
Hord Mary E
Bought by
Brandon Browning
Purchase Details
Closed on
Jun 26, 2001
Sold by
Martin William B
Bought by
Hord Mary E
Home Financials for this Owner
Home Financials are based on the most recent Mortgage that was taken out on this home.
Original Mortgage
$108,000
Interest Rate
7.17%
Purchase Details
Closed on
Jul 12, 1993
Bought by
Martin William Bert
Purchase Details
Closed on
Sep 29, 1988
Bought by
Winbush Lloyd M
Create a Home Valuation Report for This Property
The Home Valuation Report is an in-depth analysis detailing your home's value as well as a comparison with similar homes in the area
Purchase History
| Date | Buyer | Sale Price | Title Company |
|---|---|---|---|
| Crossnoe Candace | $128,000 | -- | |
| Brandon Browning | $125,000 | -- | |
| Hord Mary E | $117,000 | -- | |
| Martin William Bert | $82,000 | -- | |
| Winbush Lloyd M | -- | -- |
Source: Public Records
Mortgage History
| Date | Status | Borrower | Loan Amount |
|---|---|---|---|
| Open | Crossnoe Candace | $124,755 | |
| Previous Owner | Winbush Lloyd M | $108,000 |
Source: Public Records
Tax History
| Year | Tax Paid | Tax Assessment Tax Assessment Total Assessment is a certain percentage of the fair market value that is determined by local assessors to be the total taxable value of land and additions on the property. | Land | Improvement |
|---|---|---|---|---|
| 2025 | $855 | $45,625 | $6,250 | $39,375 |
| 2024 | $855 | $45,625 | $6,250 | $39,375 |
| 2022 | $855 | $45,625 | $6,250 | $39,375 |
| 2021 | $687 | $29,225 | $4,250 | $24,975 |
| 2020 | $687 | $29,225 | $4,250 | $24,975 |
| 2019 | $687 | $29,225 | $4,250 | $24,975 |
| 2018 | $687 | $29,225 | $4,250 | $24,975 |
| 2017 | $695 | $28,350 | $4,250 | $24,100 |
| 2016 | $610 | $28,350 | $4,250 | $24,100 |
| 2015 | $610 | $28,350 | $4,250 | $24,100 |
| 2014 | $709 | $32,975 | $4,250 | $28,725 |
Source: Public Records
Map
Nearby Homes
- 1680 Ashport Rd
- 127 Parker Dr
- 00 Ashport Rd
- 0 Ameristeel Rd
- 151 Netherwood Dr
- 26 Winston Place
- 110 Union Fort Dr
- 0 Gerdau Dr
- 77 Grande Pines Cove
- 694 Cooper Anderson Rd
- 12 Doe Valley Cove
- 36 Grande Pines Cove
- 24 Doe Valley Cove
- 11 Grande Pines Cove
- 27 Bear Trace Dr
- 179 Fairway Blvd
- 68 Brookwood Dr
- 31 Bellwood Cove
- 25 Spicewood Cove
- 25 & 35 Jack Exum Ln
- 0 8 Lots In Northmeade Woods Unit 223549
- 304 Parker Dr
- 319 Parker Dr
- 314 Parker Dr
- 14 Seay Cove
- 283 Parker Dr
- 19 Hefley Cove
- 20 Seay Cove
- 6 Weaver Cove
- 176 Glen Dillon Dr
- 30 Seay Cove
- 22 Weaver Cove
- 265 Parker Dr
- 29 Hefley Cove
- 276 Parker Dr
- 38 Seay Cove
- 251 Parker Dr
- 15 Seay Cove
- 340 Parker Dr
- 21 Seay Cove
Your Personal Tour Guide
Ask me questions while you tour the home.