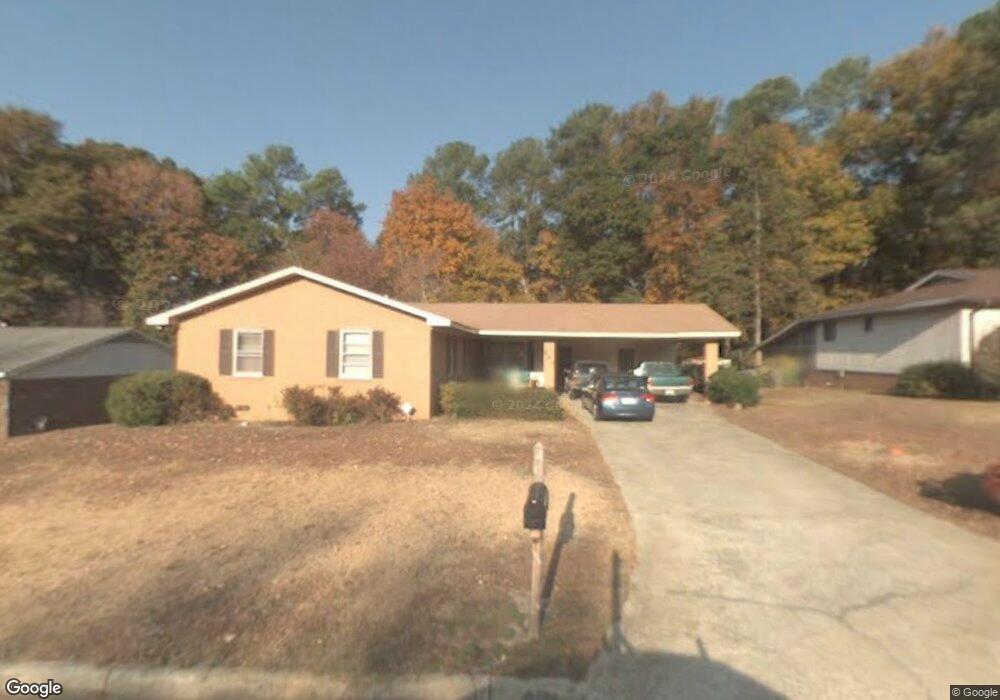
307 Valleyvue Ct Augusta, GA 30909
West Augusta NeighborhoodEstimated Value: $295,000 - $578,000
3
Beds
2
Baths
1,494
Sq Ft
$286/Sq Ft
Est. Value
About This Home
This home is located at 307 Valleyvue Ct, Augusta, GA 30909 and is currently estimated at $427,333, approximately $286 per square foot. 307 Valleyvue Ct is a home located in Richmond County with nearby schools including First Coast Technical Institute, R.B. Hunt Elementary School, and A. Brian Merry Elementary School.
Ownership History
Date
Name
Owned For
Owner Type
Purchase Details
Closed on
Sep 4, 2020
Sold by
Mv Kish Llc
Bought by
Jt Mv Kish Llc
Current Estimated Value
Purchase Details
Closed on
Sep 18, 2015
Sold by
Croft James C
Bought by
Mv Kish Llc
Purchase Details
Closed on
Jul 31, 2007
Sold by
Croft W Cleve and Croft Vicki M
Bought by
Croft Jason C
Home Financials for this Owner
Home Financials are based on the most recent Mortgage that was taken out on this home.
Original Mortgage
$95,780
Interest Rate
6.63%
Mortgage Type
Seller Take Back
Purchase Details
Closed on
Aug 8, 2003
Sold by
Heynneman Jacqueline Stacey and Clark John Edward
Bought by
Croft W Cleve and Croft Vicki M
Purchase Details
Closed on
Jan 13, 1991
Sold by
Clark Charles Hayward
Bought by
Clark Zelma M
Purchase Details
Closed on
Jan 23, 1979
Sold by
Hawkins Mary F
Bought by
Clark Zelma M
Purchase Details
Closed on
Jul 26, 1974
Sold by
Henmik Corp
Bought by
Hawkins Mary F
Create a Home Valuation Report for This Property
The Home Valuation Report is an in-depth analysis detailing your home's value as well as a comparison with similar homes in the area
Home Values in the Area
Average Home Value in this Area
Purchase History
| Date | Buyer | Sale Price | Title Company |
|---|---|---|---|
| Jt Mv Kish Llc | $389,165 | -- | |
| Mv Kish Llc | $146,025 | -- | |
| Croft Jason C | -- | None Available | |
| Croft W Cleve | $96,000 | -- | |
| Clark Zelma M | -- | -- | |
| Clark Zelma M | $42,500 | -- | |
| Hawkins Mary F | $31,300 | -- |
Source: Public Records
Mortgage History
| Date | Status | Borrower | Loan Amount |
|---|---|---|---|
| Previous Owner | Croft Jason C | $95,780 |
Source: Public Records
Tax History Compared to Growth
Tax History
| Year | Tax Paid | Tax Assessment Tax Assessment Total Assessment is a certain percentage of the fair market value that is determined by local assessors to be the total taxable value of land and additions on the property. | Land | Improvement |
|---|---|---|---|---|
| 2025 | $504 | $15,200 | $15,200 | $0 |
| 2024 | $504 | $15,200 | $15,200 | $0 |
| 2023 | $491 | $15,200 | $15,200 | $0 |
| 2022 | $1,783 | $60,613 | $15,200 | $45,413 |
| 2021 | $2,285 | $61,485 | $15,200 | $46,285 |
| 2020 | $1,896 | $49,772 | $10,000 | $39,772 |
| 2019 | $2,006 | $49,772 | $10,000 | $39,772 |
| 2018 | $2,019 | $49,772 | $10,000 | $39,772 |
| 2017 | $1,961 | $49,772 | $10,000 | $39,772 |
| 2016 | $1,963 | $49,772 | $10,000 | $39,772 |
| 2015 | $1,976 | $49,772 | $10,000 | $39,772 |
| 2014 | $1,978 | $49,772 | $10,000 | $39,772 |
Source: Public Records
Map
Nearby Homes
- 2609 Sherborne Ct
- 2918 Arrowhead Dr
- 2914 Westchester Dr
- 2920 Sussex Rd
- 2924 Mayfair Ct
- 2531 Tupelo Dr
- 2006 Glennfield Ln
- 2413 Woodbluff Ct
- 427 Aumond Rd
- 503 Sheffield Dr
- 2507 Pinebluff Ct
- 2711 Wellington Dr
- 2703 Oakbluff Ct
- 525 Henderson Dr
- 1060 Bertram Rd
- 1058 Bertram Rd
- 1056 Bertram Rd
- 2695 York Dr
- 441 Aumond Rd
- 2330 Lions Gate Dr
- 305 Valleyvue Ct
- 309 Valleyvue Ct
- 303 Valleyvue Ct
- 308 Valleyvue Ct
- 310 Valleyvue Ct
- 306 Valleyvue Ct
- 313 Valleyvue Ct
- 301 Valleyvue Ct
- 2756 Wicklow Dr
- 304 Valleyvue Ct
- 2758 Wicklow Dr
- 302 Valleyvue Ct
- 315 Valleyvue Ct
- 2760 Wicklow Dr
- 2762 Wicklow Dr
- 2752 Wicklow Dr
- 2764 Wicklow Dr
- 359 Heath Dr
- 2750 Wicklow Dr