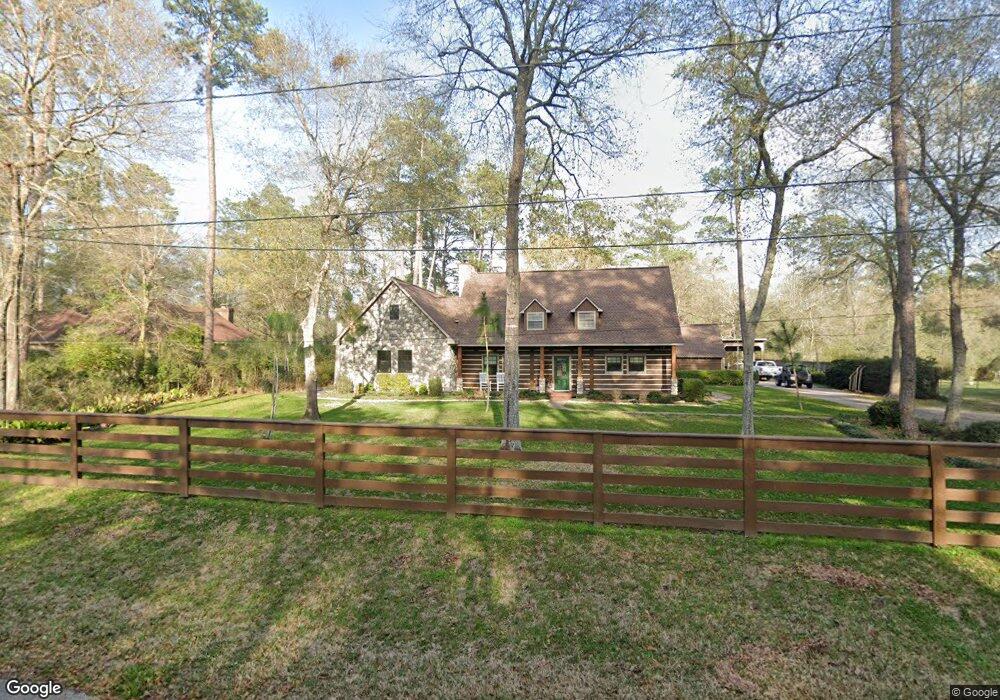
30710 William Juergens Dr Tomball, TX 77375
Estimated Value: $465,185 - $583,000
4
Beds
3
Baths
2,607
Sq Ft
$204/Sq Ft
Est. Value
About This Home
This home is located at 30710 William Juergens Dr, Tomball, TX 77375 and is currently estimated at $532,046, approximately $204 per square foot. 30710 William Juergens Dr is a home located in Harris County with nearby schools including Tomball Elementary School, Tomball Intermediate School, and Tomball Junior High School.
Create a Home Valuation Report for This Property
The Home Valuation Report is an in-depth analysis detailing your home's value as well as a comparison with similar homes in the area
Home Values in the Area
Average Home Value in this Area
Tax History Compared to Growth
Tax History
| Year | Tax Paid | Tax Assessment Tax Assessment Total Assessment is a certain percentage of the fair market value that is determined by local assessors to be the total taxable value of land and additions on the property. | Land | Improvement |
|---|---|---|---|---|
| 2025 | $6,249 | $466,878 | $127,456 | $339,422 |
| 2024 | $6,249 | $466,878 | $127,456 | $339,422 |
| 2023 | $5,239 | $466,878 | $127,456 | $339,422 |
| 2022 | $6,539 | $368,955 | $79,660 | $289,295 |
| 2021 | $6,255 | $272,485 | $49,389 | $223,096 |
| 2020 | $3,970 | $161,873 | $49,389 | $112,484 |
| 2019 | $4,084 | $161,873 | $49,389 | $112,484 |
| 2018 | $1,749 | $155,499 | $49,389 | $106,110 |
| 2017 | $3,918 | $155,499 | $49,389 | $106,110 |
| 2016 | $3,791 | $155,499 | $49,389 | $106,110 |
| 2015 | $2,797 | $155,499 | $49,389 | $106,110 |
| 2014 | $2,797 | $151,195 | $44,610 | $106,585 |
Source: Public Records
Map
Nearby Homes
- 13303 Lost Creek Rd
- 31414 Helen Ln
- 12614 Fort Isabella Dr
- 1302 Pine Trail
- 14134 Pollux Ct
- 12510 Sherborne Castle Ct
- 930 Arbor Pine
- 1319 Pine Trail
- 14123 Spring Pines Dr
- 31410 Bearing Star Ln
- 1310 Big Pines
- 11211 Stirton Dr
- 11235 Stirton Dr
- 14210 Altair Dr
- 31318 Bearing Star Ln
- 31407 Bearing Star Ln
- 31335 Bearing Star Ln
- 1315 Big Pines
- 12806 Durham Creek Ln
- 1314 Pine Brook
- 30670 William Juergens Dr
- 30819 William Juergens Dr
- 30720 William Juergens Dr
- 30715 Ulrich Rd
- 30630 William Juergens Dr
- 30723 Ulrich Rd
- 30719 Ulrich Rd
- 30730 William Juergens Dr
- 30711 Ulrich Rd
- 30618 William Juergens Dr
- 30711 William Juergens Dr
- 30711 William Juergens Dr
- 30802 William Juergens Dr
- 30602 William Juergens Dr
- 13315 Evergreen Dr
- 30606 William Juergens Dr
- 13386 Zion Rd
- 13327 Evergreen Dr
- 30733 Ulrich Rd
- 30610 William Juergens Dr