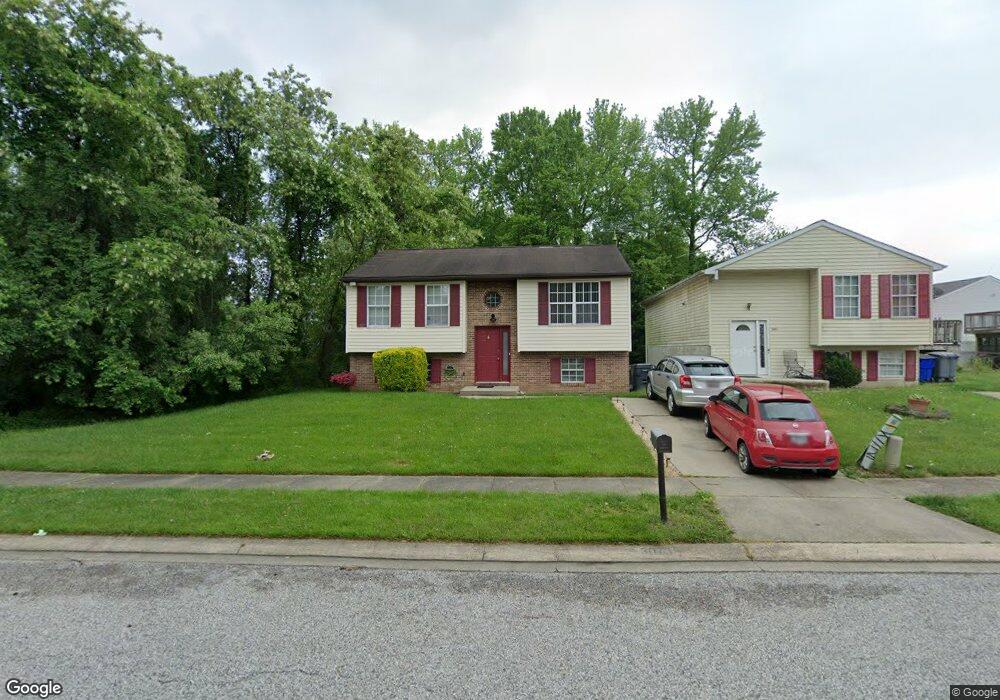
3073 Sounding Dr Edgewood, MD 21040
Estimated Value: $279,992 - $315,000
Studio
2
Baths
912
Sq Ft
$329/Sq Ft
Est. Value
About This Home
This home is located at 3073 Sounding Dr, Edgewood, MD 21040 and is currently estimated at $299,998, approximately $328 per square foot. 3073 Sounding Dr is a home located in Harford County with nearby schools including Deerfield Elementary School, Edgewood Middle School, and Edgewood High School.
Ownership History
Date
Name
Owned For
Owner Type
Purchase Details
Closed on
Jun 12, 2008
Sold by
Davis Sonja and Lawrence Sonja
Bought by
Thaniel Tamika
Current Estimated Value
Home Financials for this Owner
Home Financials are based on the most recent Mortgage that was taken out on this home.
Original Mortgage
$198,331
Outstanding Balance
$128,370
Interest Rate
6.22%
Mortgage Type
Stand Alone Refi Refinance Of Original Loan
Estimated Equity
$171,628
Purchase Details
Closed on
Apr 12, 2008
Sold by
Davis Sonja and Lawrence Sonja
Bought by
Thaniel Tamika
Home Financials for this Owner
Home Financials are based on the most recent Mortgage that was taken out on this home.
Original Mortgage
$198,331
Interest Rate
6.22%
Mortgage Type
New Conventional
Purchase Details
Closed on
Sep 30, 2004
Sold by
Lawrence James
Purchase Details
Closed on
Aug 3, 2004
Sold by
Lawrence James
Purchase Details
Closed on
May 24, 1996
Sold by
Cardwell Floyd A
Bought by
Lawrence James and Sonja Davis
Create a Home Valuation Report for This Property
The Home Valuation Report is an in-depth analysis detailing your home's value as well as a comparison with similar homes in the area
Home Values in the Area
Average Home Value in this Area
Purchase History
| Date | Buyer | Sale Price | Title Company |
|---|---|---|---|
| Thaniel Tamika | -- | -- | |
| Thaniel Tamika | -- | -- | |
| -- | -- | -- | |
| -- | -- | -- | |
| Lawrence James | $107,000 | -- |
Source: Public Records
Mortgage History
| Date | Status | Borrower | Loan Amount |
|---|---|---|---|
| Open | Thaniel Tamika | $198,331 | |
| Previous Owner | Thaniel Tamika | $198,331 | |
| Closed | -- | -- |
Source: Public Records
Tax History
| Year | Tax Paid | Tax Assessment Tax Assessment Total Assessment is a certain percentage of the fair market value that is determined by local assessors to be the total taxable value of land and additions on the property. | Land | Improvement |
|---|---|---|---|---|
| 2025 | $2,090 | $208,800 | $0 | $0 |
| 2024 | $2,090 | $195,500 | $0 | $0 |
| 2023 | $1,986 | $182,200 | $60,200 | $122,000 |
| 2022 | $1,917 | $175,900 | $0 | $0 |
| 2021 | $1,884 | $169,600 | $0 | $0 |
| 2020 | $1,884 | $163,300 | $60,200 | $103,100 |
| 2019 | $1,883 | $163,133 | $0 | $0 |
| 2018 | $1,864 | $162,967 | $0 | $0 |
| 2017 | $1,862 | $162,800 | $0 | $0 |
| 2016 | -- | $162,800 | $0 | $0 |
| 2015 | $2,288 | $162,800 | $0 | $0 |
| 2014 | $2,288 | $170,700 | $0 | $0 |
Source: Public Records
Map
Nearby Homes
- 3151 Ebbtide Dr
- 606 Harbour Oak Dr
- 62 Little Creek Ln
- 2935 Ancon Ct
- 925 Pirates Ct
- 308 Laburnum Rd
- 1071 Sand Pebble Dr
- 2961 Siwanoy Dr
- 3414 Lansdowne Ct
- 303 Lord Willoughby Way
- 408 Bauers Dr
- 2613 Thornberry Dr
- 400 Bauers Dr
- 730 Sequoia Dr
- 119 Redbud Rd
- 2707 Pulaski Hwy
- 501 Arbor Ct
- 605 Sequoia Dr
- 750 Harford Boat Club Rd
- 2425 Sycamore Ln
- 3071 Sounding Dr
- 3069 Sounding Dr
- 649 Haven Place
- 647 Haven Place
- 3101 Sounding Dr
- 645 Haven Place
- 3072 Sounding Dr
- 3070 Sounding Dr
- 3103 Sounding Dr
- 611 Tradewinds Ct
- 3068 Sounding Dr
- 3066 Sounding Dr
- 643 Haven Place
- 609 Tradewinds Ct
- 3105 Sounding Dr
- 3064 Sounding Dr
- 610 Tradewinds Ct
- 632 Haven Place
- 3100 Sounding Dr
- 3062 Sounding Dr
Your Personal Tour Guide
Ask me questions while you tour the home.