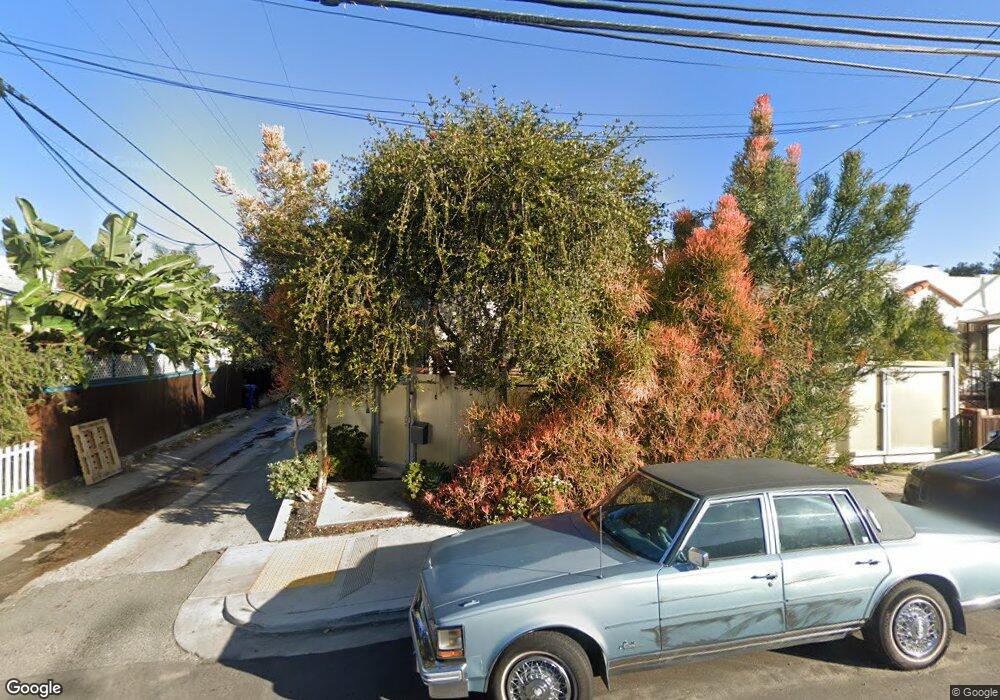
3076 Thorn St San Diego, CA 92104
North Park NeighborhoodEstimated Value: $938,000 - $1,271,000
3
Beds
1
Bath
1,118
Sq Ft
$982/Sq Ft
Est. Value
About This Home
This home is located at 3076 Thorn St, San Diego, CA 92104 and is currently estimated at $1,097,542, approximately $981 per square foot. 3076 Thorn St is a home located in San Diego County with nearby schools including McKinley Elementary School, Roosevelt International Middle School, and Mcgill School Of Success.
Ownership History
Date
Name
Owned For
Owner Type
Purchase Details
Closed on
Oct 15, 2021
Sold by
Davies Appie L
Bought by
Davies John M
Current Estimated Value
Purchase Details
Closed on
Mar 5, 2010
Sold by
Catala Alexander
Bought by
Davies John Mills and Davies Philip
Home Financials for this Owner
Home Financials are based on the most recent Mortgage that was taken out on this home.
Original Mortgage
$471,306
Outstanding Balance
$311,903
Interest Rate
4.95%
Mortgage Type
FHA
Estimated Equity
$785,639
Purchase Details
Closed on
May 1, 2000
Sold by
Wahl Michael D and Wahl Terri L
Bought by
Catala Alexander
Home Financials for this Owner
Home Financials are based on the most recent Mortgage that was taken out on this home.
Original Mortgage
$134,615
Interest Rate
8.53%
Mortgage Type
FHA
Purchase Details
Closed on
Dec 7, 1990
Purchase Details
Closed on
Sep 27, 1989
Purchase Details
Closed on
Oct 28, 1987
Create a Home Valuation Report for This Property
The Home Valuation Report is an in-depth analysis detailing your home's value as well as a comparison with similar homes in the area
Home Values in the Area
Average Home Value in this Area
Purchase History
| Date | Buyer | Sale Price | Title Company |
|---|---|---|---|
| Davies John M | -- | None Available | |
| Davies John Mills | $480,000 | Fidelity National Title | |
| Catala Alexander | $140,000 | Southland Title | |
| -- | $119,500 | -- | |
| -- | $103,500 | -- | |
| -- | $56,700 | -- |
Source: Public Records
Mortgage History
| Date | Status | Borrower | Loan Amount |
|---|---|---|---|
| Open | Davies John Mills | $471,306 | |
| Previous Owner | Catala Alexander | $134,615 |
Source: Public Records
Tax History Compared to Growth
Tax History
| Year | Tax Paid | Tax Assessment Tax Assessment Total Assessment is a certain percentage of the fair market value that is determined by local assessors to be the total taxable value of land and additions on the property. | Land | Improvement |
|---|---|---|---|---|
| 2025 | $9,412 | $783,302 | $535,995 | $247,307 |
| 2024 | $9,412 | $767,944 | $525,486 | $242,458 |
| 2023 | $9,202 | $752,887 | $515,183 | $237,704 |
| 2022 | $8,954 | $738,126 | $505,082 | $233,044 |
| 2021 | $6,981 | $568,695 | $355,436 | $213,259 |
| 2020 | $6,895 | $562,865 | $351,792 | $211,073 |
| 2019 | $6,771 | $551,830 | $344,895 | $206,935 |
| 2018 | $6,330 | $541,011 | $338,133 | $202,878 |
| 2017 | $6,178 | $530,403 | $331,503 | $198,900 |
| 2016 | $6,077 | $520,003 | $325,003 | $195,000 |
| 2015 | $5,987 | $512,193 | $320,122 | $192,071 |
| 2014 | $5,891 | $502,161 | $313,852 | $188,309 |
Source: Public Records
Map
Nearby Homes
- 3084 Thorn St
- 3064 Thorn St
- 3310 31st St Unit 16
- 3090 Thorn St
- 3087 Thorn St
- 3087 Thorn St Unit 89
- 3322 31st St
- 3309 Grim Ave Unit 15
- 3067 Thorn St
- 3243 Grim Ave
- 3236 31st St
- 3317 Grim Ave
- 3330 31st St
- 3329 Grim Ave
- 3303 31st St
- 3233 Grim Ave Unit 35
- 3309 31st St
- 3321 Grim Ave
- 3230 31st St
- 3323 Grim Ave