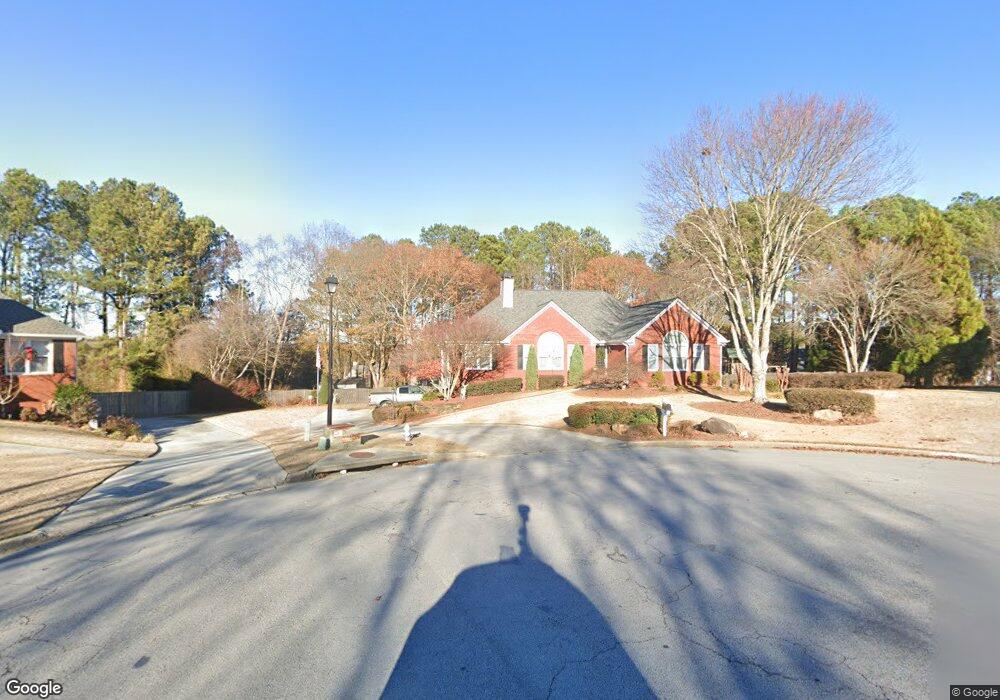
3077 Hillsong Cir Unit 2 Dacula, GA 30019
Estimated Value: $378,047 - $469,000
3
Beds
2
Baths
1,906
Sq Ft
$218/Sq Ft
Est. Value
About This Home
This home is located at 3077 Hillsong Cir Unit 2, Dacula, GA 30019 and is currently estimated at $415,262, approximately $217 per square foot. 3077 Hillsong Cir Unit 2 is a home located in Gwinnett County with nearby schools including Fort Daniel Elementary School, Frank N. Osborne Middle School, and Mill Creek High School.
Ownership History
Date
Name
Owned For
Owner Type
Purchase Details
Closed on
Aug 20, 2024
Sold by
Costardo Susan M
Bought by
Costardo Ralph A Tr and Costardo Susan M Tr
Current Estimated Value
Purchase Details
Closed on
May 28, 2015
Sold by
Johnson James Pierce
Bought by
Costardo Susan M and Costardo Ralph A
Home Financials for this Owner
Home Financials are based on the most recent Mortgage that was taken out on this home.
Original Mortgage
$125,001
Interest Rate
3.79%
Mortgage Type
New Conventional
Purchase Details
Closed on
Mar 31, 1995
Sold by
Richardson Butler Inc
Bought by
Johnson James P
Purchase Details
Closed on
Dec 15, 1994
Sold by
Royale Securities Inc
Bought by
Richardson Butler Inc
Home Financials for this Owner
Home Financials are based on the most recent Mortgage that was taken out on this home.
Original Mortgage
$207,000
Interest Rate
9.23%
Mortgage Type
Construction
Create a Home Valuation Report for This Property
The Home Valuation Report is an in-depth analysis detailing your home's value as well as a comparison with similar homes in the area
Home Values in the Area
Average Home Value in this Area
Purchase History
| Date | Buyer | Sale Price | Title Company |
|---|---|---|---|
| Costardo Ralph A Tr | -- | -- | |
| Costardo Susan M | $230,000 | -- | |
| Johnson James P | $131,700 | -- | |
| Richardson Butler Inc | $41,000 | -- |
Source: Public Records
Mortgage History
| Date | Status | Borrower | Loan Amount |
|---|---|---|---|
| Previous Owner | Costardo Susan M | $125,001 | |
| Previous Owner | Richardson Butler Inc | $207,000 | |
| Closed | Johnson James P | $0 |
Source: Public Records
Tax History Compared to Growth
Tax History
| Year | Tax Paid | Tax Assessment Tax Assessment Total Assessment is a certain percentage of the fair market value that is determined by local assessors to be the total taxable value of land and additions on the property. | Land | Improvement |
|---|---|---|---|---|
| 2025 | $1,189 | $166,720 | $44,000 | $122,720 |
| 2024 | $1,203 | $146,040 | $31,600 | $114,440 |
| 2023 | $1,203 | $142,360 | $31,600 | $110,760 |
| 2022 | $1,164 | $128,280 | $31,600 | $96,680 |
| 2021 | $1,142 | $98,640 | $24,400 | $74,240 |
| 2020 | $1,140 | $92,240 | $21,440 | $70,800 |
| 2019 | $1,056 | $84,520 | $20,400 | $64,120 |
| 2018 | $1,038 | $84,520 | $20,400 | $64,120 |
| 2016 | $1,076 | $72,120 | $16,800 | $55,320 |
| 2015 | $2,240 | $66,600 | $14,400 | $52,200 |
| 2014 | -- | $63,520 | $14,400 | $49,120 |
Source: Public Records
Map
Nearby Homes
- 3304 Brooksong Way Unit 2
- 1470 Highland Forge Ct
- 1615 Burnt Oak Way
- 1495 Mill Place Dr
- 2915 Dacula Oaks Dr Unit 1
- 3177 Hog Mountain Rd
- 1758 Auburn Ridge Way
- 1372 Auburn Rd
- 2636 Grove Valley Ln
- 2955 Windsong Park Ln Unit 1
- 1356 Belfaire Trace
- 1385 Auburn Glen Rd
- 2070 Trinity Mill Dr
- 1843 Hamilton Mill Pkwy
- 1385 Auburn Rd
- 1355 Auburn Glen Rd
- 1345 Auburn Glen Rd
- 1375 Auburn Rd
- 1365 Auburn Rd
- 3077 Hillsong Cir
- 3067 Hillsong Cir
- 3072 Hillsong Cir Unit 2
- 3209 Brooksong Way
- 3199 Brooksong Way
- 3107 Brooksong Ct
- 1445 Windsong Park Dr NE
- 0 Hillsong Cir Unit 7383270
- 0 Hillsong Cir Unit 8778564
- 0 Hillsong Cir Unit 8416189
- 0 Hillsong Cir Unit 7302996
- 3219 Brooksong Way
- 3062 Hillsong Cir
- 1445 Windsong Park Dr
- 3117 Brooksong Ct Unit 5
- 3097 Brooksong Ct
- 1465 Windsong Park Dr
- 1465 Windsong Park Dr
- 1435 Windsong Park Dr
- 3229 Brooksong Way Unit 4