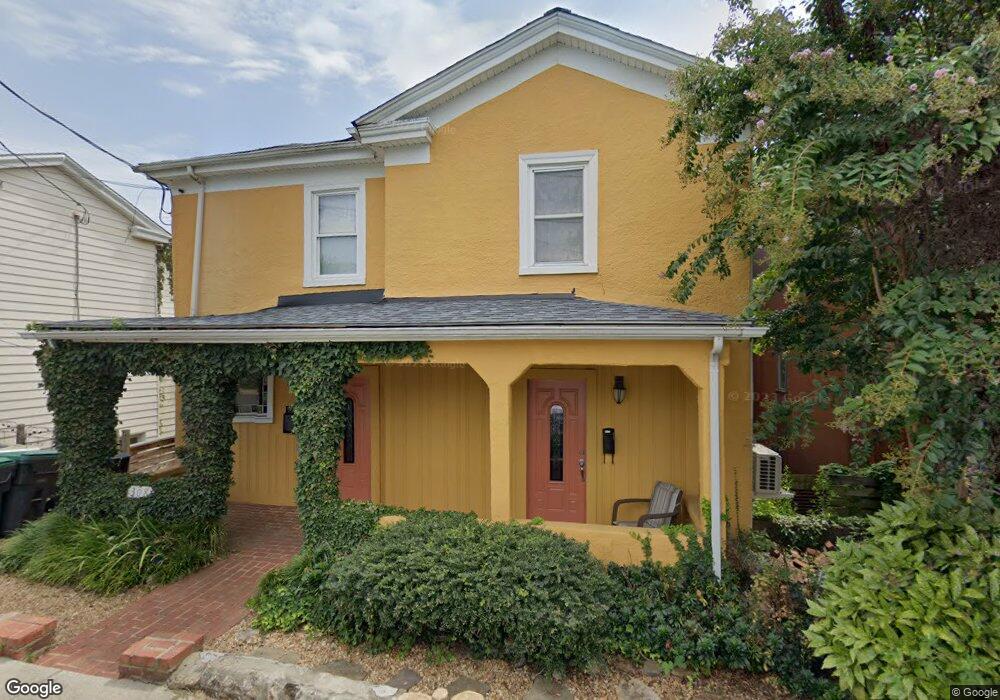
308 6th St SW Charlottesville, VA 22903
Fifeville NeighborhoodEstimated Value: $623,487 - $692,000
5
Beds
3
Baths
2,410
Sq Ft
$272/Sq Ft
Est. Value
About This Home
This home is located at 308 6th St SW, Charlottesville, VA 22903 and is currently estimated at $655,122, approximately $271 per square foot. 308 6th St SW is a home located in Charlottesville City with nearby schools including Summit Elementary School, Buford Middle School, and Charlottesville High School.
Ownership History
Date
Name
Owned For
Owner Type
Purchase Details
Closed on
Jul 21, 2025
Sold by
Clark Michael
Bought by
Phillips Elizabeth Grace and Gartman Russell Duane
Current Estimated Value
Home Financials for this Owner
Home Financials are based on the most recent Mortgage that was taken out on this home.
Original Mortgage
$552,500
Outstanding Balance
$551,550
Interest Rate
6.77%
Estimated Equity
$103,572
Purchase Details
Closed on
Oct 6, 2011
Bought by
Clark Michael
Create a Home Valuation Report for This Property
The Home Valuation Report is an in-depth analysis detailing your home's value as well as a comparison with similar homes in the area
Home Values in the Area
Average Home Value in this Area
Purchase History
| Date | Buyer | Sale Price | Title Company |
|---|---|---|---|
| Phillips Elizabeth Grace | $650,000 | Old Republic National Title In | |
| Clark Michael | $180,000 | -- |
Source: Public Records
Mortgage History
| Date | Status | Borrower | Loan Amount |
|---|---|---|---|
| Open | Phillips Elizabeth Grace | $552,500 |
Source: Public Records
Tax History Compared to Growth
Tax History
| Year | Tax Paid | Tax Assessment Tax Assessment Total Assessment is a certain percentage of the fair market value that is determined by local assessors to be the total taxable value of land and additions on the property. | Land | Improvement |
|---|---|---|---|---|
| 2025 | $4,740 | $477,800 | $110,500 | $367,300 |
| 2024 | $4,740 | $423,500 | $122,200 | $301,300 |
| 2023 | $3,922 | $402,500 | $112,400 | $290,100 |
| 2022 | $3,271 | $334,700 | $92,900 | $241,800 |
| 2021 | $2,381 | $244,600 | $69,900 | $174,700 |
| 2020 | $2,112 | $216,300 | $45,700 | $170,600 |
| 2019 | $2,074 | $212,300 | $44,800 | $167,500 |
| 2018 | $951 | $194,200 | $40,700 | $153,500 |
| 2017 | $1,359 | $194,160 | $40,700 | $153,460 |
| 2016 | $1,297 | $130,500 | $37,000 | $93,500 |
| 2015 | $1,240 | $130,500 | $37,000 | $93,500 |
| 2014 | $1,240 | $130,500 | $37,000 | $93,500 |
Source: Public Records
Map
Nearby Homes
- 301 7th St SW
- 208 SE 7th St
- 765 Walker Square Unit 4B
- 211 Cream St Unit 202
- 107 Almere Ave
- 836 & Lot Ridge St
- 250 W Main St Unit 402
- 218 W Water St Unit 600
- 218 W Water St Unit 801
- 218 W Water St Unit 705
- 918 King St
- 716 S 1st St
- 716 1st St S
- 921 Cherry Ave
- 200 Garrett St Unit 612
- 200 Garrett St Unit 504