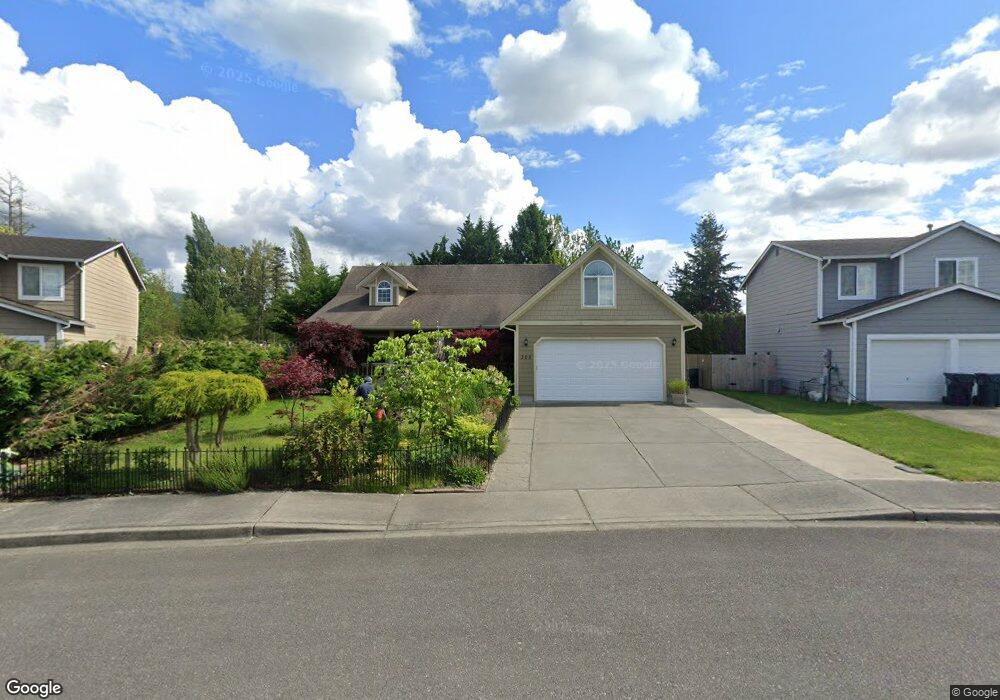
308 Allison Way Nooksack, WA 98247
Estimated Value: $512,000 - $545,086
3
Beds
2
Baths
1,623
Sq Ft
$324/Sq Ft
Est. Value
About This Home
This home is located at 308 Allison Way, Nooksack, WA 98247 and is currently estimated at $526,272, approximately $324 per square foot. 308 Allison Way is a home located in Whatcom County with nearby schools including Nooksack Elementary School, Everson Elementary School, and Sumas Elementary School.
Ownership History
Date
Name
Owned For
Owner Type
Purchase Details
Closed on
Sep 28, 2006
Sold by
Brown Doug and Brown Debbie
Bought by
Vizcarra Rafael and Vizcarra Consolacion
Current Estimated Value
Home Financials for this Owner
Home Financials are based on the most recent Mortgage that was taken out on this home.
Original Mortgage
$245,600
Outstanding Balance
$144,793
Interest Rate
6.43%
Mortgage Type
Unknown
Estimated Equity
$381,479
Purchase Details
Closed on
Jan 4, 2006
Sold by
Burch Daniel W and Burch Edee
Bought by
Brown Doug and Brown Debbie
Create a Home Valuation Report for This Property
The Home Valuation Report is an in-depth analysis detailing your home's value as well as a comparison with similar homes in the area
Home Values in the Area
Average Home Value in this Area
Purchase History
| Date | Buyer | Sale Price | Title Company |
|---|---|---|---|
| Vizcarra Rafael | $307,280 | Stewart Title Company | |
| Brown Doug | $95,280 | First American Title Insuran |
Source: Public Records
Mortgage History
| Date | Status | Borrower | Loan Amount |
|---|---|---|---|
| Open | Vizcarra Rafael | $245,600 |
Source: Public Records
Tax History Compared to Growth
Tax History
| Year | Tax Paid | Tax Assessment Tax Assessment Total Assessment is a certain percentage of the fair market value that is determined by local assessors to be the total taxable value of land and additions on the property. | Land | Improvement |
|---|---|---|---|---|
| 2024 | $864 | $478,331 | $180,000 | $298,331 |
| 2023 | $817 | $497,747 | $137,744 | $360,003 |
| 2022 | $4,017 | $448,429 | $124,096 | $324,333 |
| 2021 | $3,487 | $370,607 | $102,560 | $268,047 |
| 2020 | $3,344 | $282,009 | $83,384 | $198,625 |
| 2019 | $2,887 | $282,009 | $83,384 | $198,625 |
| 2018 | $3,239 | $270,564 | $80,000 | $190,564 |
| 2017 | $2,902 | $226,418 | $63,800 | $162,618 |
| 2016 | $2,774 | $208,938 | $58,850 | $150,088 |
| 2015 | $2,364 | $200,443 | $56,760 | $143,683 |
| 2014 | -- | $194,228 | $55,000 | $139,228 |
| 2013 | -- | $194,228 | $55,000 | $139,228 |
Source: Public Records
Map
Nearby Homes
- 107 S Pass Rd Unit 14
- 107 S Pass Rd Unit 23
- 308 W 3rd St
- 304 W 3rd St
- 404 W 3rd St
- 412 W 3rd St
- 1204 E Georgia Ln
- 109 W 2nd St
- 409 Amareen Ct
- 705 E 5th St
- 3599 Breckenridge Rd
- 921 Whispering Meadows Ct
- 7554 Nooksack Rd
- 201 Brentwood Dr
- 207 E Main St
- 108 Baker St Unit 1-4
- 205 Reeds Ln Unit 64
- 404 W 4th St
- 400 W 4th St
- 405 W 4th St
- 306 Allison Way
- 310 Allison Way
- 231 Hertel Way
- 403 E 2nd Ave
- 304 Allison Way
- 312 Allison Way
- 232 Hertel Way
- 406 E 2nd St
- 302 Allison Way
- 229 Hertel Way
- 314 Allison Way
- 407 Allison Way
- 216 Allison Way
- 408 E 2nd St
- 316 Allison Way
- 230 Hertel Way
- 237 Hertel Way
- 227 Hertel Way
- 402 Allison Way
- 214 Allison Way