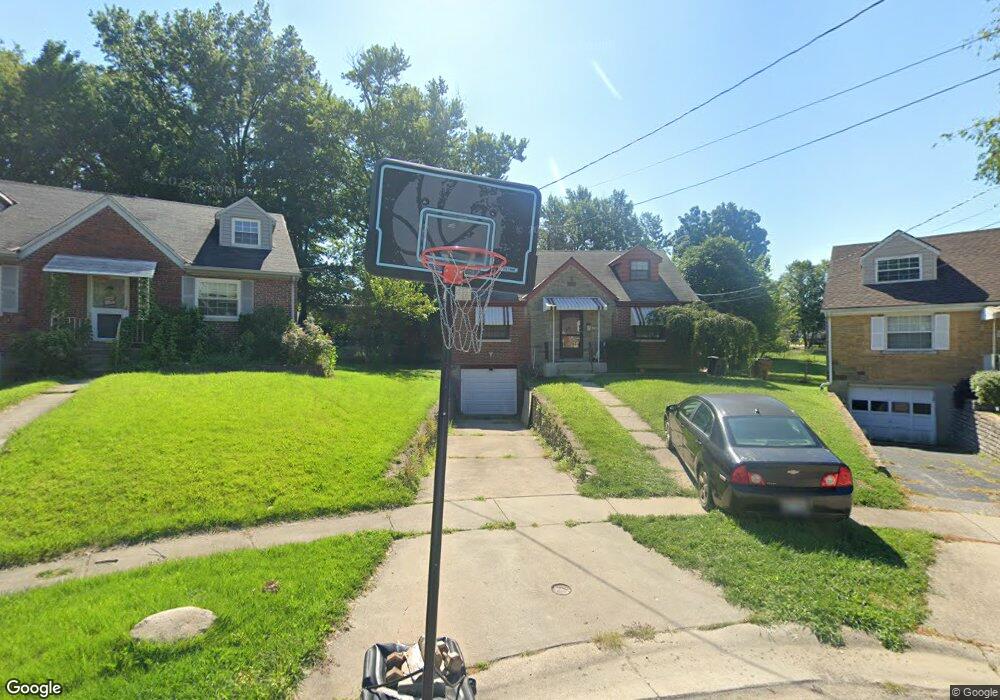
308 Don Ln Cincinnati, OH 45238
Delshire NeighborhoodEstimated Value: $195,000 - $230,000
4
Beds
2
Baths
1,795
Sq Ft
$118/Sq Ft
Est. Value
About This Home
This home is located at 308 Don Ln, Cincinnati, OH 45238 and is currently estimated at $211,686, approximately $117 per square foot. 308 Don Ln is a home located in Hamilton County with nearby schools including Delshire Elementary School, Delhi Middle School, and Oak Hills High School.
Ownership History
Date
Name
Owned For
Owner Type
Purchase Details
Closed on
Apr 12, 2011
Sold by
Arkwright Brent D
Bought by
Harris Nathaniel L
Current Estimated Value
Home Financials for this Owner
Home Financials are based on the most recent Mortgage that was taken out on this home.
Original Mortgage
$67,367
Outstanding Balance
$45,693
Interest Rate
4.75%
Mortgage Type
FHA
Estimated Equity
$165,993
Purchase Details
Closed on
Jul 18, 2008
Sold by
Goodman Scott A
Bought by
Arkwright Brent D
Home Financials for this Owner
Home Financials are based on the most recent Mortgage that was taken out on this home.
Original Mortgage
$127,687
Interest Rate
6.36%
Mortgage Type
VA
Purchase Details
Closed on
Apr 14, 2000
Sold by
Dalton Sandra
Bought by
Goodman Scott A
Home Financials for this Owner
Home Financials are based on the most recent Mortgage that was taken out on this home.
Original Mortgage
$69,622
Interest Rate
8.22%
Mortgage Type
FHA
Create a Home Valuation Report for This Property
The Home Valuation Report is an in-depth analysis detailing your home's value as well as a comparison with similar homes in the area
Home Values in the Area
Average Home Value in this Area
Purchase History
| Date | Buyer | Sale Price | Title Company |
|---|---|---|---|
| Harris Nathaniel L | $72,000 | Attorney | |
| Arkwright Brent D | $125,000 | Springdale Title Agency Llc | |
| Goodman Scott A | $70,000 | -- |
Source: Public Records
Mortgage History
| Date | Status | Borrower | Loan Amount |
|---|---|---|---|
| Open | Harris Nathaniel L | $67,367 | |
| Previous Owner | Arkwright Brent D | $127,687 | |
| Previous Owner | Goodman Scott A | $69,622 |
Source: Public Records
Tax History
| Year | Tax Paid | Tax Assessment Tax Assessment Total Assessment is a certain percentage of the fair market value that is determined by local assessors to be the total taxable value of land and additions on the property. | Land | Improvement |
|---|---|---|---|---|
| 2025 | $3,022 | $50,855 | $8,890 | $41,965 |
| 2024 | $2,950 | $50,855 | $8,890 | $41,965 |
| 2023 | $2,958 | $50,855 | $8,890 | $41,965 |
| 2022 | $2,038 | $31,133 | $7,917 | $23,216 |
| 2021 | $1,995 | $31,133 | $7,917 | $23,216 |
| 2020 | $2,023 | $31,133 | $7,917 | $23,216 |
| 2019 | $1,940 | $26,838 | $6,825 | $20,013 |
| 2018 | $1,942 | $26,838 | $6,825 | $20,013 |
| 2017 | $1,753 | $26,838 | $6,825 | $20,013 |
| 2016 | $1,562 | $23,944 | $7,151 | $16,793 |
| 2015 | $1,564 | $23,944 | $7,151 | $16,793 |
| 2014 | $1,565 | $23,944 | $7,151 | $16,793 |
| 2013 | $1,551 | $25,200 | $7,525 | $17,675 |
Source: Public Records
Map
Nearby Homes
- 4938 Mount Alverno Rd
- 4635 Mayhew Ave
- 4457 Delhi Rd
- 4380 Glenhaven Rd
- 4979 Bonaventure Ct
- 4351 Mount Alverno Rd
- 4271 Champdale Ln
- 4209 Delryan Dr
- 5140 Old Oak Trail
- 4294 Mayhew Ave
- 3738 Hillside Ave
- 3744 Hillside Ave
- 3938 Hillside Ave
- 298 Kinsman Ct
- 3908 Pattison Ave
- 576 Claymore Terrace
- 517 Trenton Ave
- 4711 Foley Rd
- 287 Shaker Ct
- 560 Virgil Rd
- 312 Don Ln
- 307 Bob Dr
- 303 Bob Dr
- 316 Don Ln
- 311 Bob Dr
- 301 Don Ln
- 315 Bob Dr
- 305 Don Ln
- 320 Don Ln
- 4772 Mount Alverno Rd
- 4750 Mt Alverno
- 4784 Mount Alverno Rd
- 4738 Mount Alverno Rd
- 4798 Mount Alverno Rd
- 4750 Mount Alverno Rd
- 4810 Mount Alverno Rd
- 319 Bob Dr
- 309 Don Ln
- 4822 Mount Alverno Rd
- 313 Don Ln
Your Personal Tour Guide
Ask me questions while you tour the home.