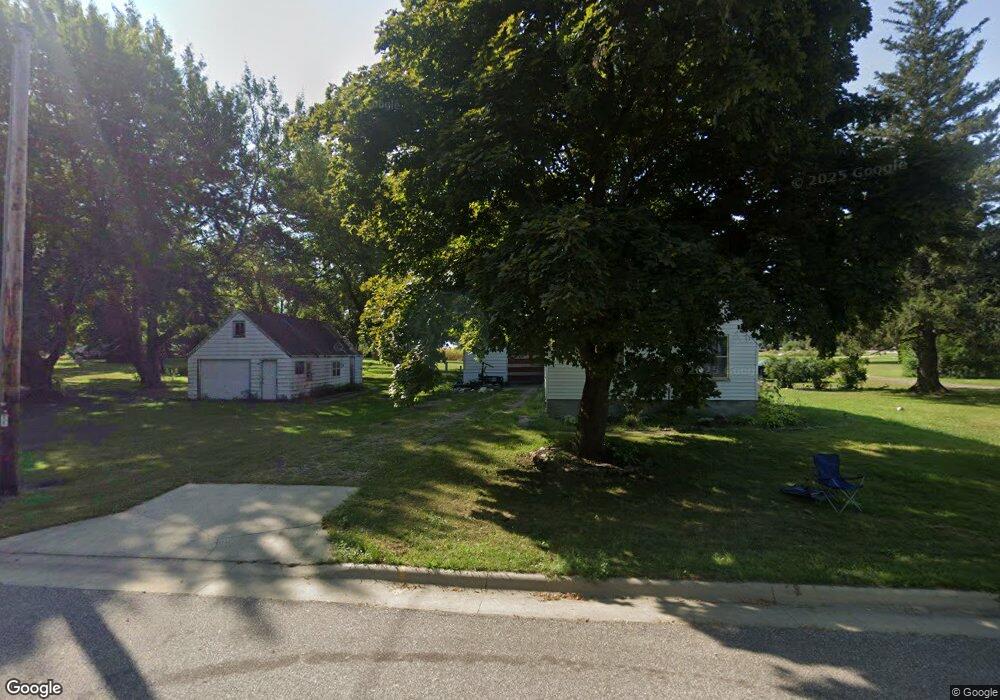
308 E Maple St Ringsted, IA 50578
Estimated Value: $57,161 - $73,000
3
Beds
1
Bath
1,107
Sq Ft
$57/Sq Ft
Est. Value
About This Home
This home is located at 308 E Maple St, Ringsted, IA 50578 and is currently estimated at $63,290, approximately $57 per square foot. 308 E Maple St is a home located in Emmet County with nearby schools including North Union High School.
Ownership History
Date
Name
Owned For
Owner Type
Purchase Details
Closed on
Jun 20, 2023
Sold by
Oak Tree Properties Llc
Bought by
Moffett Dustin and Moffett Sara
Current Estimated Value
Purchase Details
Closed on
Dec 5, 2020
Sold by
Oak Tree Properties Llc
Bought by
C & J Holdings Inc
Home Financials for this Owner
Home Financials are based on the most recent Mortgage that was taken out on this home.
Original Mortgage
$9,100
Interest Rate
4%
Mortgage Type
New Conventional
Purchase Details
Closed on
Aug 26, 2019
Sold by
Moore Brenda
Bought by
Cherry Grove Investments
Create a Home Valuation Report for This Property
The Home Valuation Report is an in-depth analysis detailing your home's value as well as a comparison with similar homes in the area
Purchase History
| Date | Buyer | Sale Price | Title Company |
|---|---|---|---|
| Moffett Dustin | $11,000 | None Listed On Document | |
| C & J Holdings Inc | $9,900 | None Available | |
| Cherry Grove Investments | $712 | -- |
Source: Public Records
Mortgage History
| Date | Status | Borrower | Loan Amount |
|---|---|---|---|
| Previous Owner | C & J Holdings Inc | $9,100 |
Source: Public Records
Tax History
| Year | Tax Paid | Tax Assessment Tax Assessment Total Assessment is a certain percentage of the fair market value that is determined by local assessors to be the total taxable value of land and additions on the property. | Land | Improvement |
|---|---|---|---|---|
| 2025 | $386 | $26,800 | $13,500 | $13,300 |
| 2024 | $386 | $19,800 | $10,800 | $9,000 |
| 2023 | $308 | $19,800 | $10,800 | $9,000 |
| 2022 | $292 | $14,500 | $10,800 | $3,700 |
| 2021 | $572 | $14,500 | $10,800 | $3,700 |
| 2020 | $537 | $12,400 | $8,700 | $3,700 |
| 2019 | $498 | $11,900 | $0 | $0 |
| 2018 | $557 | $11,900 | $0 | $0 |
| 2017 | $518 | $13,800 | $0 | $0 |
| 2016 | $616 | $13,800 | $0 | $0 |
| 2015 | $254 | $13,100 | $0 | $0 |
| 2014 | $260 | $22,400 | $0 | $0 |
Source: Public Records
Map
Nearby Homes
Your Personal Tour Guide
Ask me questions while you tour the home.