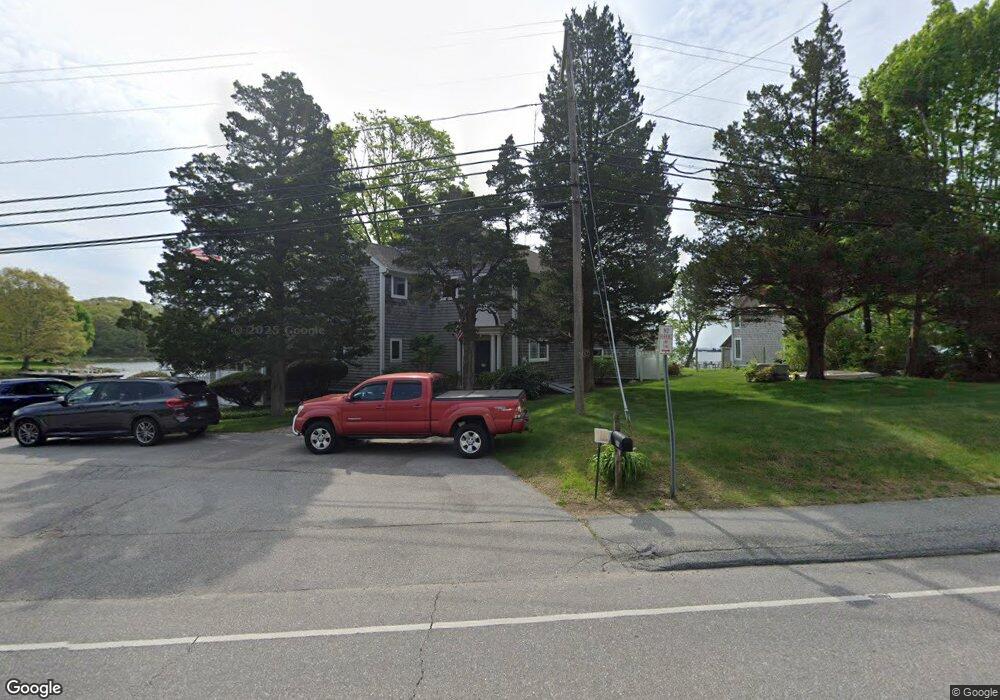
308 Elm St Groton, CT 06340
West Mystic NeighborhoodEstimated Value: $538,000 - $1,151,521
2
Beds
3
Baths
2,712
Sq Ft
$332/Sq Ft
Est. Value
About This Home
This home is located at 308 Elm St, Groton, CT 06340 and is currently estimated at $901,630, approximately $332 per square foot. 308 Elm St is a home located in New London County with nearby schools including Groton Middle School and Robert E. Fitch High School.
Ownership History
Date
Name
Owned For
Owner Type
Purchase Details
Closed on
Aug 14, 2023
Sold by
Lukowski Ruth O
Bought by
Ruth O Lukowski T O and Ruth Lukowski
Current Estimated Value
Purchase Details
Closed on
Apr 9, 2010
Sold by
Broushton Paul Est and Watkinson
Bought by
Bombay Douglas
Create a Home Valuation Report for This Property
The Home Valuation Report is an in-depth analysis detailing your home's value as well as a comparison with similar homes in the area
Home Values in the Area
Average Home Value in this Area
Purchase History
| Date | Buyer | Sale Price | Title Company |
|---|---|---|---|
| Ruth O Lukowski T O | -- | None Available | |
| Bombay Douglas | $255,000 | -- |
Source: Public Records
Mortgage History
| Date | Status | Borrower | Loan Amount |
|---|---|---|---|
| Previous Owner | Bombay Douglas | $75,000 | |
| Previous Owner | Bombay Douglas | $140,000 | |
| Previous Owner | Bombay Douglas | $227,000 | |
| Previous Owner | Bombay Douglas | $285,000 |
Source: Public Records
Tax History
| Year | Tax Paid | Tax Assessment Tax Assessment Total Assessment is a certain percentage of the fair market value that is determined by local assessors to be the total taxable value of land and additions on the property. | Land | Improvement |
|---|---|---|---|---|
| 2025 | $16,038 | $607,950 | $384,902 | $223,048 |
| 2024 | $14,974 | $607,950 | $384,902 | $223,048 |
| 2023 | $14,354 | $607,950 | $289,310 | $318,640 |
| 2022 | $14,062 | $607,950 | $289,310 | $318,640 |
| 2021 | $14,169 | $512,260 | $298,620 | $213,640 |
| 2020 | $13,805 | $512,260 | $298,620 | $213,640 |
| 2019 | $13,180 | $512,260 | $298,620 | $213,640 |
| 2018 | $13,194 | $516,180 | $298,620 | $217,560 |
| 2017 | $12,966 | $516,180 | $298,620 | $217,560 |
| 2016 | $11,799 | $508,130 | $307,440 | $200,690 |
| 2015 | $11,352 | $508,130 | $307,440 | $200,690 |
| 2014 | $11,062 | $508,130 | $307,440 | $200,690 |
Source: Public Records
Map
Nearby Homes
Your Personal Tour Guide
Ask me questions while you tour the home.