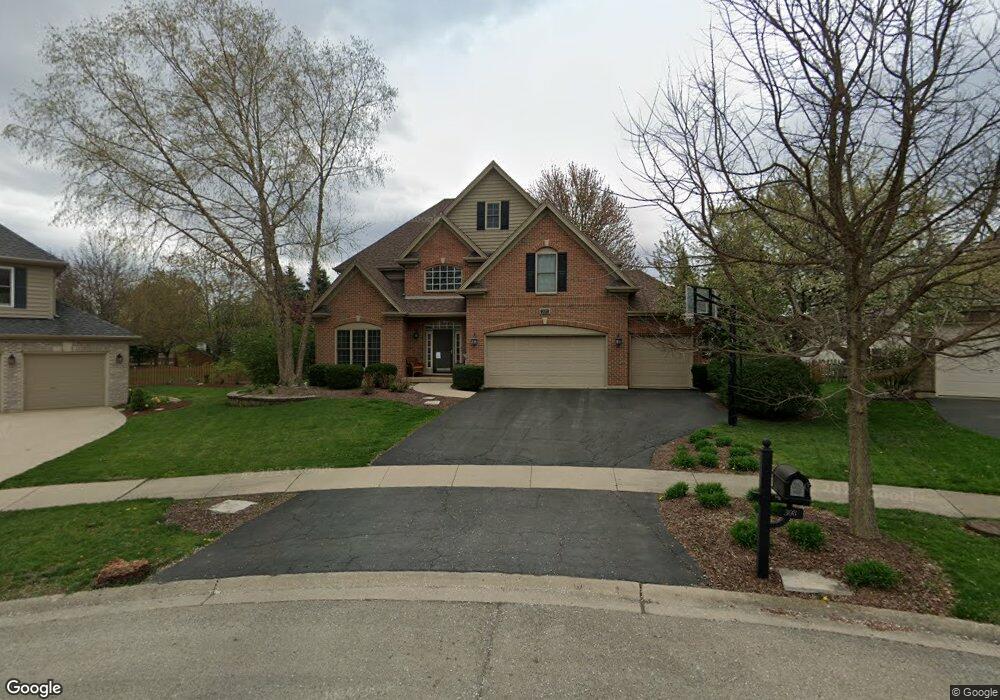
308 Flintlock Ct Oswego, IL 60543
North Oswego NeighborhoodEstimated Value: $491,633 - $538,000
4
Beds
3
Baths
2,536
Sq Ft
$204/Sq Ft
Est. Value
About This Home
This home is located at 308 Flintlock Ct, Oswego, IL 60543 and is currently estimated at $517,158, approximately $203 per square foot. 308 Flintlock Ct is a home located in Kendall County with nearby schools including Old Post Elementary School, Thompson Jr. High School, and Oswego High School.
Ownership History
Date
Name
Owned For
Owner Type
Purchase Details
Closed on
Nov 16, 2011
Sold by
Bucher David and Clem Michelle
Bought by
Bucher David and Bucher Michelle
Current Estimated Value
Home Financials for this Owner
Home Financials are based on the most recent Mortgage that was taken out on this home.
Original Mortgage
$151,375
Outstanding Balance
$14,630
Interest Rate
3.29%
Mortgage Type
New Conventional
Estimated Equity
$502,528
Purchase Details
Closed on
Nov 9, 2004
Sold by
Smith Heather
Bought by
Bucher David and Clem Michelle
Home Financials for this Owner
Home Financials are based on the most recent Mortgage that was taken out on this home.
Original Mortgage
$235,000
Interest Rate
5.91%
Mortgage Type
Purchase Money Mortgage
Purchase Details
Closed on
Feb 20, 2001
Sold by
Oliver Hoffmann Corp
Bought by
Smith Heather
Home Financials for this Owner
Home Financials are based on the most recent Mortgage that was taken out on this home.
Original Mortgage
$265,350
Interest Rate
7.07%
Purchase Details
Closed on
Oct 1, 1992
Bought by
Oliver -Hoffmann Corp
Create a Home Valuation Report for This Property
The Home Valuation Report is an in-depth analysis detailing your home's value as well as a comparison with similar homes in the area
Home Values in the Area
Average Home Value in this Area
Purchase History
| Date | Buyer | Sale Price | Title Company |
|---|---|---|---|
| Bucher David | -- | Tek Title Llc | |
| Bucher David | $355,000 | -- | |
| Smith Heather | $312,500 | -- | |
| Oliver -Hoffmann Corp | $2,988,600 | -- |
Source: Public Records
Mortgage History
| Date | Status | Borrower | Loan Amount |
|---|---|---|---|
| Open | Bucher David | $151,375 | |
| Closed | Bucher David | $235,000 | |
| Previous Owner | Smith Heather | $265,350 | |
| Closed | Oliver -Hoffmann Corp | -- |
Source: Public Records
Tax History
| Year | Tax Paid | Tax Assessment Tax Assessment Total Assessment is a certain percentage of the fair market value that is determined by local assessors to be the total taxable value of land and additions on the property. | Land | Improvement |
|---|---|---|---|---|
| 2024 | $11,002 | $142,711 | $29,094 | $113,617 |
| 2023 | $10,508 | $130,928 | $26,692 | $104,236 |
| 2022 | $10,508 | $122,363 | $24,946 | $97,417 |
| 2021 | $9,847 | $111,239 | $22,678 | $88,561 |
| 2020 | $9,165 | $102,999 | $20,998 | $82,001 |
| 2019 | $8,796 | $97,634 | $20,998 | $76,636 |
| 2018 | $9,902 | $105,065 | $24,292 | $80,773 |
| 2017 | $9,741 | $101,024 | $23,358 | $77,666 |
| 2016 | $9,578 | $98,082 | $22,678 | $75,404 |
| 2015 | $4,867 | $95,225 | $22,017 | $73,208 |
| 2014 | -- | $90,691 | $20,969 | $69,722 |
| 2013 | -- | $91,607 | $21,181 | $70,426 |
Source: Public Records
Map
Nearby Homes
- 397 Cascade Ln Unit 2
- 129 Seton Creek Dr
- 510 Waterford Dr
- 135 Chesterfield Dr
- 521 Waterford Dr
- 57 Seton Creek Dr
- 232 Julep Ave
- 109 Old Post Rd
- 225 Mondovi Dr
- 100 Piper Glen Ave
- 719 Alberta Ave
- 714 Alberta Ave
- 104 Piper Glen Ave
- 215 Willington Way
- 74 Paddock St
- 611 Paris Ave
- 703 Pomfret Ct
- 136 Piper Glen Ave
- 748 Alberta Ave
- 138 Piper Glen Ave
- 310 Flintlock Ct Unit 2
- 305 Cascade Ln
- 309 Cascade Ln
- 307 Flintlock Ct Unit 2
- 313 Cascade Ln
- 301 Cascade Ln
- 312 Flintlock Ct Unit 2
- 305 Flintlock Ct Unit 2
- 319 Cascade Ln Unit 1
- 317 Cascade Ln
- 303 Flintlock Ct Unit 2
- 314 Flintlock Ct Unit 2
- 304 Cascade Ln Unit 2
- 306 Cascade Ln Unit 3
- 308 Cascade Ln Unit 4
- 302 Cascade Ln Unit 1
- 323 Cascade Ln Unit 2
- 325 Cascade Ln Unit 1
- 310 Cascade Ln Unit 1
- 314 Cascade Ln Unit 3
Your Personal Tour Guide
Ask me questions while you tour the home.