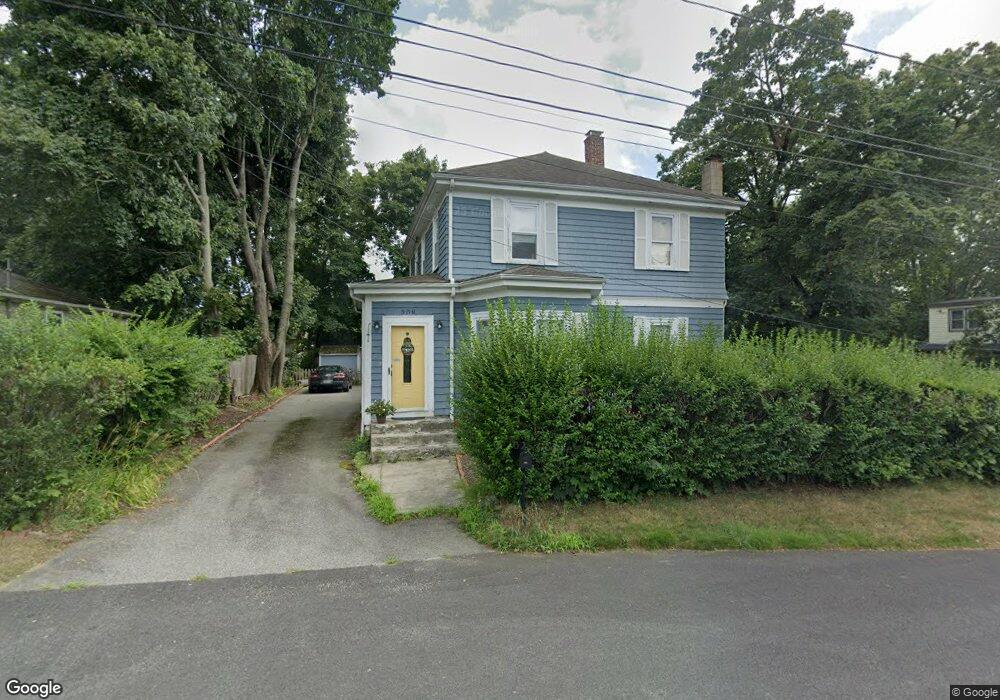
308 Grove Ave Warwick, RI 02889
Long Meadow NeighborhoodEstimated Value: $400,472 - $440,000
4
Beds
2
Baths
1,756
Sq Ft
$239/Sq Ft
Est. Value
About This Home
This home is located at 308 Grove Ave, Warwick, RI 02889 and is currently estimated at $418,868, approximately $238 per square foot. 308 Grove Ave is a home located in Kent County with nearby schools including Saint Kevin School and Bishop Hendricken High School.
Ownership History
Date
Name
Owned For
Owner Type
Purchase Details
Closed on
May 31, 2001
Sold by
Priestley Robert T
Bought by
Mccann Garry P and Mccann Paige J
Current Estimated Value
Purchase Details
Closed on
Jul 19, 2000
Sold by
Dinardi Christine R
Bought by
Priestley Robert T
Purchase Details
Closed on
Oct 22, 1999
Sold by
Ocwen Fed Savings Bank
Bought by
Dinardi Christine R
Create a Home Valuation Report for This Property
The Home Valuation Report is an in-depth analysis detailing your home's value as well as a comparison with similar homes in the area
Home Values in the Area
Average Home Value in this Area
Purchase History
| Date | Buyer | Sale Price | Title Company |
|---|---|---|---|
| Mccann Garry P | $115,000 | -- | |
| Priestley Robert T | $101,000 | -- | |
| Dinardi Christine R | $48,000 | -- | |
| Ocwen Fed Bank | $61,500 | -- |
Source: Public Records
Mortgage History
| Date | Status | Borrower | Loan Amount |
|---|---|---|---|
| Open | Ocwen Fed Bank | $25,000 | |
| Closed | Ocwen Fed Bank | $14,000 | |
| Open | Ocwen Fed Bank | $119,000 |
Source: Public Records
Tax History
| Year | Tax Paid | Tax Assessment Tax Assessment Total Assessment is a certain percentage of the fair market value that is determined by local assessors to be the total taxable value of land and additions on the property. | Land | Improvement |
|---|---|---|---|---|
| 2025 | $4,475 | $352,400 | $115,700 | $236,700 |
| 2024 | $4,230 | $292,300 | $100,600 | $191,700 |
| 2023 | $4,148 | $292,300 | $100,600 | $191,700 |
| 2022 | $3,971 | $212,000 | $64,800 | $147,200 |
| 2021 | $3,971 | $212,000 | $64,800 | $147,200 |
| 2020 | $3,971 | $212,000 | $64,800 | $147,200 |
| 2019 | $3,971 | $212,000 | $64,800 | $147,200 |
| 2018 | $3,494 | $168,000 | $64,800 | $103,200 |
| 2017 | $3,400 | $168,000 | $64,800 | $103,200 |
| 2016 | $3,400 | $168,000 | $64,800 | $103,200 |
| 2015 | $3,366 | $162,200 | $61,200 | $101,000 |
| 2014 | $3,254 | $162,200 | $61,200 | $101,000 |
| 2013 | $3,210 | $162,200 | $61,200 | $101,000 |
Source: Public Records
Map
Nearby Homes
- 132 Palmer Ave
- 00 Grove Ave
- 123 Payton Ave
- 283 Palmer Ave
- 43 Beaver Ave
- 0 Meadow View Ave
- 357 Warwick Neck Ave
- 34 Chapin Ave
- 299 Palmer Ave
- 320 Palmer Ave
- 0 Avon Ave
- 59 Recess Ln
- 15 Center Ct
- 276 Tidewater Dr
- 14 Beatrice Ave
- 19 Beatrice Ave
- 0 Samuel Gorton Ave
- 66 Medford St
- 76 Medford St
- 38 Pender Ave
Your Personal Tour Guide
Ask me questions while you tour the home.