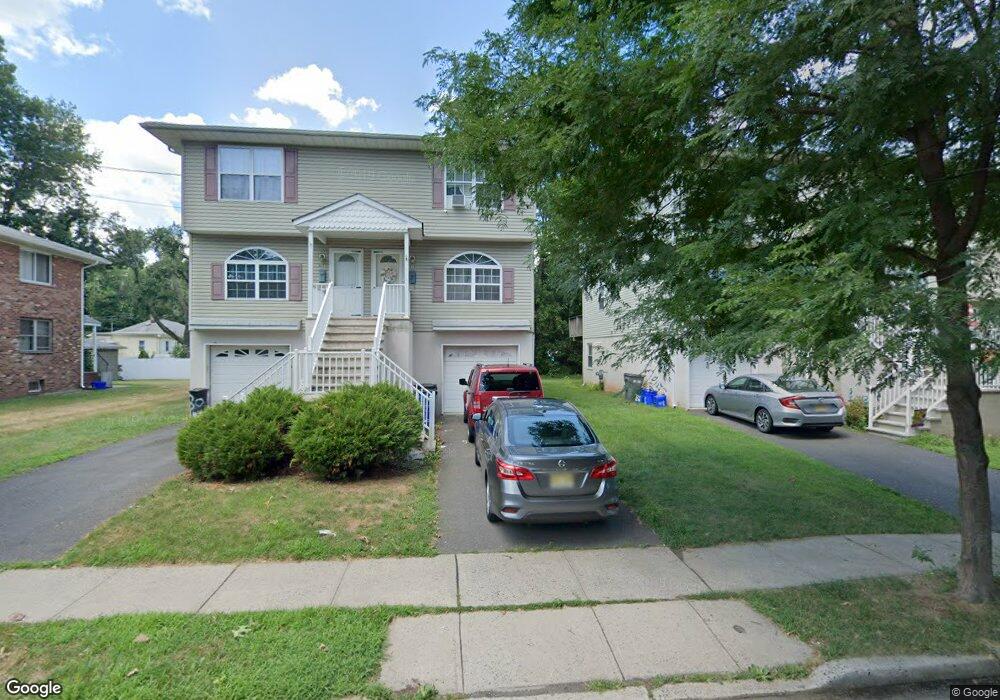
308 High St Unit 310 Dunellen, NJ 08812
Estimated Value: $610,465 - $723,000
3
Beds
2
Baths
3,060
Sq Ft
$214/Sq Ft
Est. Value
About This Home
This home is located at 308 High St Unit 310, Dunellen, NJ 08812 and is currently estimated at $653,366, approximately $213 per square foot. 308 High St Unit 310 is a home located in Middlesex County with nearby schools including John P. Faber Elementary School, Lincoln Middle School, and Dunellen High School.
Ownership History
Date
Name
Owned For
Owner Type
Purchase Details
Closed on
Sep 22, 2017
Sold by
Buck James A and Buck Jeanmarie M
Bought by
J & J Buck Realty Ii Llc
Current Estimated Value
Home Financials for this Owner
Home Financials are based on the most recent Mortgage that was taken out on this home.
Original Mortgage
$287,250
Outstanding Balance
$239,097
Interest Rate
3.78%
Mortgage Type
New Conventional
Estimated Equity
$414,269
Purchase Details
Closed on
Aug 31, 2012
Sold by
Churchill Asset Management Llc
Bought by
Buck James A and Buck Jeanmarie M
Home Financials for this Owner
Home Financials are based on the most recent Mortgage that was taken out on this home.
Original Mortgage
$273,750
Interest Rate
3.57%
Mortgage Type
New Conventional
Purchase Details
Closed on
Nov 24, 2003
Sold by
Grafke Alfred R
Bought by
Churchill Asset Management
Purchase Details
Closed on
Apr 23, 1998
Sold by
Kosciuszko Tadeusz
Bought by
Charles Facciponti and Ponti Builders
Create a Home Valuation Report for This Property
The Home Valuation Report is an in-depth analysis detailing your home's value as well as a comparison with similar homes in the area
Home Values in the Area
Average Home Value in this Area
Purchase History
| Date | Buyer | Sale Price | Title Company |
|---|---|---|---|
| J & J Buck Realty Ii Llc | -- | Foundation Title Llc | |
| Buck James A | $365,000 | Fidelity National Title Ins | |
| Churchill Asset Management | $336,000 | -- | |
| Charles Facciponti | $55,200 | -- |
Source: Public Records
Mortgage History
| Date | Status | Borrower | Loan Amount |
|---|---|---|---|
| Open | J & J Buck Realty Ii Llc | $287,250 | |
| Closed | Buck James A | $273,750 |
Source: Public Records
Tax History
| Year | Tax Paid | Tax Assessment Tax Assessment Total Assessment is a certain percentage of the fair market value that is determined by local assessors to be the total taxable value of land and additions on the property. | Land | Improvement |
|---|---|---|---|---|
| 2025 | $12,603 | $502,500 | $93,600 | $408,900 |
| 2024 | $13,608 | $502,500 | $93,600 | $408,900 |
| 2023 | $13,608 | $502,500 | $93,600 | $408,900 |
| 2022 | $13,874 | $502,500 | $93,600 | $408,900 |
| 2021 | $12,006 | $419,600 | $93,600 | $326,000 |
| 2020 | $12,567 | $386,900 | $90,000 | $296,900 |
| 2019 | $12,006 | $386,900 | $90,000 | $296,900 |
| 2018 | $10,373 | $76,800 | $21,400 | $55,400 |
| 2017 | $9,953 | $76,800 | $21,400 | $55,400 |
| 2016 | $9,590 | $76,800 | $21,400 | $55,400 |
| 2015 | $9,351 | $76,800 | $21,400 | $55,400 |
| 2014 | $9,153 | $76,800 | $21,400 | $55,400 |
Source: Public Records
Map
Nearby Homes
- 309-311 Pulaski St
- 577 S South Ave S
- 364 S Madison Ave
- 219 Gertrude Terrace
- 1 Hall St
- 250 Whittier Ave
- 529 Dunellen Ave
- 310 Sanford Ave
- 419 Dunellen Ave
- 821 Front St
- 713 1st St
- 405 Madison Ave
- 820 Front St
- 400 Valmere Ave
- 500 2nd St
- 203 S Washington Ave
- 241 Orange St
- 417 2nd St
- 36 Lehigh Ave
- 228 Park Ln
- 308-310 High St
- 306 High St
- 304 High St Unit 306
- 318 High St
- 318 High St Unit 1
- 747 Walnut St Unit 747
- 745 Walnut St
- 320 High St Unit 322
- 313 Pulaski St
- 309 Pulaski St Unit 311
- 315 Pulaski St Unit 315A
- 315-315A Pulaski St
- 749 Walnut St
- 324 High St Unit 326
- 323 Pulaski St
- 741 Walnut St
- 301 High St
- 309 High St
- 313 High St
- 737 Walnut St
Your Personal Tour Guide
Ask me questions while you tour the home.