Estimated Value: $86,864 - $126,000
About This Home
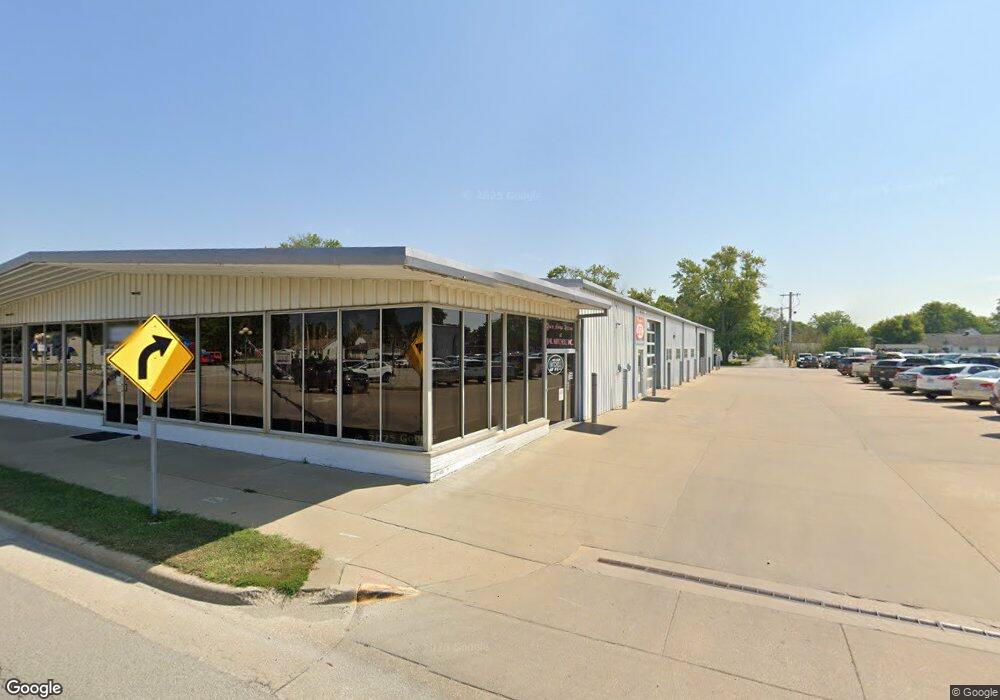
This home is located at 308 N Central Ave, Casey, IL 62420 and is currently estimated at $112,966, approximately $85 per square foot. 308 N Central Ave is a home located in Clark County with nearby schools including Monroe Elementary School and Casey-Westfield Jr-Sr High School.
Ownership History
We collect this data history from publicly available records. To have your information removed, we recommend requesting removal directly through your county’s website.
Purchase Details
Home Financials for this Owner
Home Financials are based on the most recent Mortgage that was taken out on this home.Purchase Details
Purchase Details
Purchase Details
Home Financials for this Owner
Home Financials are based on the most recent Mortgage that was taken out on this home.Purchase History
We collect this data history from publicly available records. To have your information removed, we recommend requesting removal directly through your county’s website.
| Date | Buyer | Sale Price | Title Company |
|---|---|---|---|
| $610,000 | Attorney | ||
| $47,500 | None Available | ||
| -- | None Available | ||
| $18,500 | None Available |
Mortgage History
We collect this data history from publicly available records. To have your information removed, we recommend requesting removal directly through your county’s website.
| Date | Status | Borrower | Loan Amount |
|---|---|---|---|
| Closed | $450,200 | ||
| Previous Owner | $28,000 |
Tax History
We collect this data history from publicly available records. To have your information removed, we recommend requesting removal directly through your county’s website.
| Year | Tax Paid | Tax Assessment Tax Assessment Total Assessment is a certain percentage of the fair market value that is determined by local assessors to be the total taxable value of land and additions on the property. | Land | Improvement |
|---|---|---|---|---|
| 2024 | $1,824 | $23,179 | $3,105 | $20,074 |
| 2023 | $1,754 | $23,179 | $3,105 | $20,074 |
| 2022 | $1,783 | $20,695 | $2,772 | $17,923 |
| 2021 | $1,821 | $20,695 | $2,772 | $17,923 |
| 2019 | $1,659 | $17,669 | $2,772 | $14,897 |
| 2018 | $1,680 | $17,669 | $2,772 | $14,897 |
| 2017 | $1,704 | $18,070 | $2,835 | $15,235 |
| 2016 | $1,628 | $16,180 | $2,870 | $13,310 |
| 2015 | $1,573 | $16,624 | $2,949 | $13,675 |
| 2014 | $1,551 | $16,180 | $2,870 | $13,310 |
| 2013 | $1,551 | $16,085 | $2,775 | $13,310 |
Map
- 0 Illinois 49
- 10 W Alabama Ave
- 14 N Central Ave Unit 107
- 16 E Main St
- 403 E Alabama Ave
- 0 Highway 40 W
- 200 W Main St
- 104 S Central Ave
- 112 NW 4th St
- 203 NW 4th St
- 209 S Central Ave
- 4 Cribelar Ln
- 307 SW 2nd St
- 202 W Madison Ave
- 205 W Madison Ave
- 1005 E Alabama Ave
- 706 E Madison St
- 706 E Madison Ave
- 705 S Central Ave
- 705 SW 2nd St
- 308 N Central Ave
- 308 N Central Ave
- 308 N Central Ave
- 308 N Central Ave
- 308 N Central Ave
- 308 N Central Ave
- 308 N Central Ave
- 308 N Central Ave
- 308 N Central Ave
- 308 N Central Ave
- 4 W Delaware Ave
- 7 E Delaware Ave
- 9 E Delaware Ave
- 2 E Colorado Ave
- 2 E Delaware Ave
- 101 E Delaware Ave
- 8 E Delaware Ave
- 8 E Colorado Ave
- 103 E Delaware Ave
- 105 E Delaware Ave
Ask me questions while you tour the home.