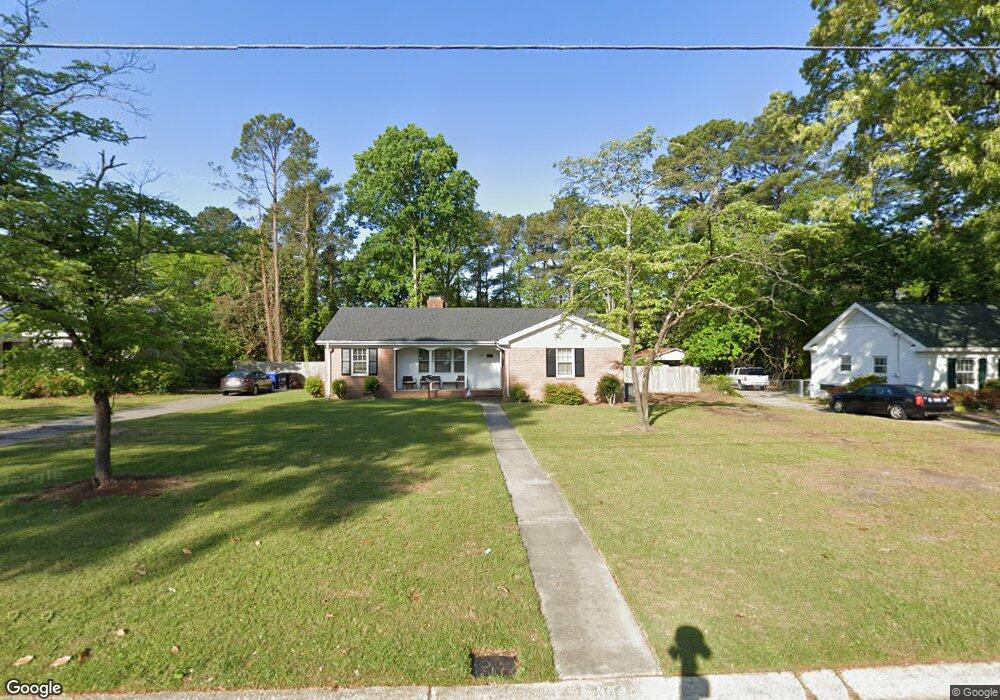
308 Rainier Dr Fayetteville, NC 28314
Terry Sanford NeighborhoodEstimated Value: $225,000 - $252,000
3
Beds
2
Baths
1,611
Sq Ft
$147/Sq Ft
Est. Value
About This Home
This home is located at 308 Rainier Dr, Fayetteville, NC 28314 and is currently estimated at $236,376, approximately $146 per square foot. 308 Rainier Dr is a home located in Cumberland County with nearby schools including Vanstory Hills Elementary School, Alma O Easom Elementary, and R. Max Abbott Middle School.
Ownership History
Date
Name
Owned For
Owner Type
Purchase Details
Closed on
Aug 9, 2018
Sold by
Roach Roy L and Roach Coletta L
Bought by
Bell Charles T
Current Estimated Value
Home Financials for this Owner
Home Financials are based on the most recent Mortgage that was taken out on this home.
Original Mortgage
$99,000
Outstanding Balance
$85,977
Interest Rate
4.5%
Mortgage Type
New Conventional
Estimated Equity
$150,399
Purchase Details
Closed on
Apr 4, 2011
Sold by
Fralix Harriet M
Bought by
Cleary Robert A
Create a Home Valuation Report for This Property
The Home Valuation Report is an in-depth analysis detailing your home's value as well as a comparison with similar homes in the area
Home Values in the Area
Average Home Value in this Area
Purchase History
| Date | Buyer | Sale Price | Title Company |
|---|---|---|---|
| Bell Charles T | $110,000 | None Available | |
| Cleary Robert A | -- | -- |
Source: Public Records
Mortgage History
| Date | Status | Borrower | Loan Amount |
|---|---|---|---|
| Open | Bell Charles T | $99,000 |
Source: Public Records
Tax History Compared to Growth
Tax History
| Year | Tax Paid | Tax Assessment Tax Assessment Total Assessment is a certain percentage of the fair market value that is determined by local assessors to be the total taxable value of land and additions on the property. | Land | Improvement |
|---|---|---|---|---|
| 2024 | $2,706 | $131,387 | $38,000 | $93,387 |
| 2023 | $2,537 | $131,387 | $38,000 | $93,387 |
| 2022 | $2,283 | $131,387 | $38,000 | $93,387 |
| 2021 | $2,283 | $131,387 | $38,000 | $93,387 |
| 2019 | $2,248 | $148,600 | $38,000 | $110,600 |
| 2018 | $2,248 | $148,600 | $38,000 | $110,600 |
| 2017 | $2,145 | $148,600 | $38,000 | $110,600 |
| 2016 | $1,612 | $118,985 | $38,000 | $80,985 |
| 2015 | $1,596 | $118,985 | $38,000 | $80,985 |
| 2014 | $1,589 | $118,985 | $38,000 | $80,985 |
Source: Public Records
Map
Nearby Homes