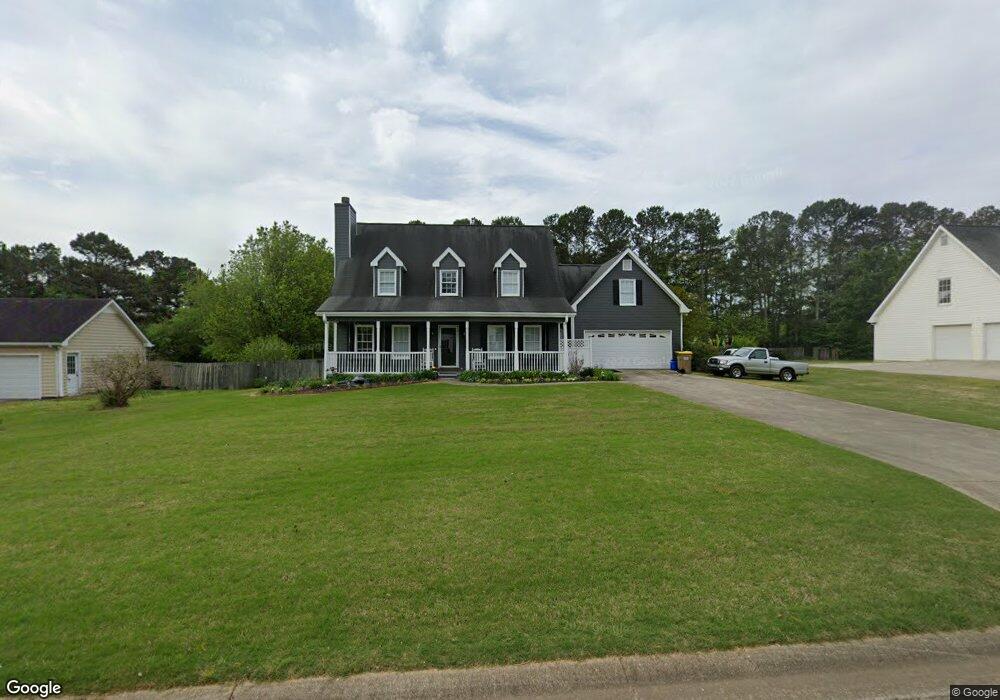
308 Ron Dr Unit 2 Bethlehem, GA 30620
Estimated Value: $346,475 - $373,000
4
Beds
3
Baths
2,130
Sq Ft
$168/Sq Ft
Est. Value
About This Home
This home is located at 308 Ron Dr Unit 2, Bethlehem, GA 30620 and is currently estimated at $358,619, approximately $168 per square foot. 308 Ron Dr Unit 2 is a home located in Barrow County with nearby schools including Yargo Elementary School, Haymon-Morris Middle School, and Apalachee High School.
Ownership History
Date
Name
Owned For
Owner Type
Purchase Details
Closed on
Apr 24, 2009
Sold by
Sturdy Nelletia D
Bought by
Barrick Nelletia
Current Estimated Value
Purchase Details
Closed on
May 17, 2005
Sold by
Simmons Steve A and Simmons Alicia
Bought by
Sturdy Nelletia D
Home Financials for this Owner
Home Financials are based on the most recent Mortgage that was taken out on this home.
Original Mortgage
$165,000
Interest Rate
6%
Mortgage Type
New Conventional
Purchase Details
Closed on
Jul 23, 2001
Sold by
Smith Thomas C and Smith Sharon D
Bought by
Simmons Steve A and Simmons Alicia A
Home Financials for this Owner
Home Financials are based on the most recent Mortgage that was taken out on this home.
Original Mortgage
$128,250
Interest Rate
7.09%
Mortgage Type
New Conventional
Purchase Details
Closed on
Jan 4, 1998
Sold by
Creekview Builders
Bought by
Smith Thomas C and Smith Sharon D
Home Financials for this Owner
Home Financials are based on the most recent Mortgage that was taken out on this home.
Original Mortgage
$119,700
Interest Rate
7.2%
Mortgage Type
New Conventional
Purchase Details
Closed on
Oct 2, 1997
Sold by
C G S Development In
Bought by
Creekview Builders I
Purchase Details
Closed on
Jul 9, 1996
Bought by
C G S Development In
Create a Home Valuation Report for This Property
The Home Valuation Report is an in-depth analysis detailing your home's value as well as a comparison with similar homes in the area
Home Values in the Area
Average Home Value in this Area
Purchase History
| Date | Buyer | Sale Price | Title Company |
|---|---|---|---|
| Barrick Nelletia | -- | -- | |
| Sturdy Nelletia D | $165,000 | -- | |
| Simmons Steve A | $142,500 | -- | |
| Smith Thomas C | $126,000 | -- | |
| Creekview Builders I | $57,000 | -- | |
| C G S Development In | -- | -- |
Source: Public Records
Mortgage History
| Date | Status | Borrower | Loan Amount |
|---|---|---|---|
| Previous Owner | Sturdy Nelletia D | $165,000 | |
| Previous Owner | Simmons Steve A | $128,250 | |
| Previous Owner | Smith Thomas C | $119,700 |
Source: Public Records
Tax History
| Year | Tax Paid | Tax Assessment Tax Assessment Total Assessment is a certain percentage of the fair market value that is determined by local assessors to be the total taxable value of land and additions on the property. | Land | Improvement |
|---|---|---|---|---|
| 2025 | $2,652 | $113,706 | $26,800 | $86,906 |
| 2024 | $2,714 | $111,152 | $26,800 | $84,352 |
| 2023 | $2,305 | $111,552 | $26,800 | $84,752 |
| 2022 | $2,641 | $94,045 | $22,400 | $71,645 |
| 2021 | $2,597 | $87,645 | $16,000 | $71,645 |
| 2020 | $2,086 | $70,448 | $16,000 | $54,448 |
| 2019 | $2,122 | $70,448 | $16,000 | $54,448 |
| 2018 | $2,011 | $67,648 | $13,200 | $54,448 |
| 2017 | $1,719 | $59,025 | $13,200 | $45,825 |
| 2016 | $1,486 | $51,457 | $13,200 | $38,257 |
| 2015 | $1,506 | $51,908 | $13,200 | $38,708 |
| 2014 | $1,331 | $45,626 | $6,468 | $39,158 |
| 2013 | -- | $43,188 | $6,468 | $36,720 |
Source: Public Records
Map
Nearby Homes
- 209 Angie Way
- 1129 Loganville Hwy
- 0 Loganville Hwy Unit 7710356
- 1111 Otis Dr
- 630 Bridle Creek Dr
- 923 Downing Dr
- 0 Jb Owens Unit 7552902
- 0 Jb Owens Unit 7552891
- 0 Jb Owens Unit LOT 2 - 2.09 ACRES
- 0 Jb Owens Unit LOT 3 - 2.01 ACRES
- 609 Mcdowell Ln
- 190 Lokeys Ln
- 1309 Tom Miller Rd
- 1188 Carl-Bethlehem Rd
- 449 Carl Bethlehem Rd SW
- 637 Sleeping Meadow Ln
- 738 Worth Ct
- 286 Meadows Dr
- 720 Westbury Ct
- 308 Meadows Dr
- 306 Ron Dr Unit 2
- 310 Ron Dr Unit 2
- 304 Ron Dr Unit 2
- 312 Ron Dr Unit 2
- 0 Stonewilde at Turnberr Unit 3173599
- 307 Ron Dr Unit 2
- 409 Lokeys Ridge Rd
- 305 Ron Dr
- 411 Lokeys Ridge Rd Unit 54A
- 411 Lokeys Ridge Rd
- 407 Lokeys Ridge Rd Unit 52A
- 407 Lokeys Ridge Rd
- 314 Ron Dr
- 311 Ron Dr
- 302 Ron Dr
- 413 Lokeys Ridge Rd
- 407 Lokey's Ridge Rd
- 413 Lokey's Ridge Rd
- 313 Ron Dr
- 415 Lokeys Ridge Rd Unit Ga1439