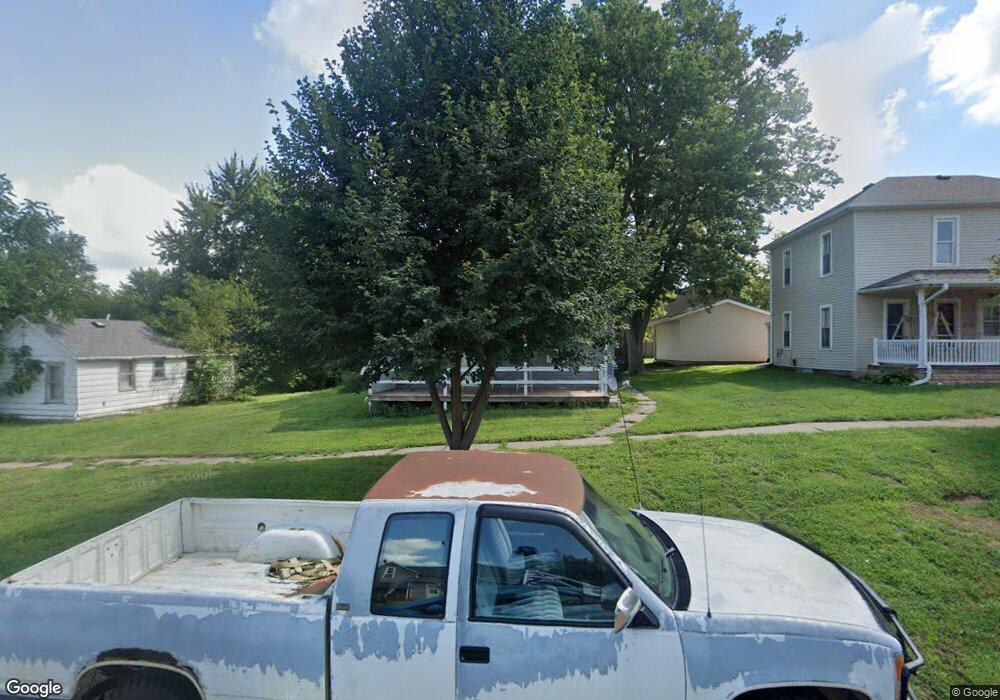
308 S 3rd St Mapleton, IA 51034
Estimated Value: $91,000 - $105,000
3
Beds
1
Bath
915
Sq Ft
$106/Sq Ft
Est. Value
About This Home
This home is located at 308 S 3rd St, Mapleton, IA 51034 and is currently estimated at $96,887, approximately $105 per square foot. 308 S 3rd St is a home with nearby schools including Mapleton Elementary School, Mvao Middle School, and Maple Valley-Anthon Oto High School.
Ownership History
Date
Name
Owned For
Owner Type
Purchase Details
Closed on
Apr 27, 2023
Sold by
Mckee Amanda F
Bought by
Pecor Nina
Current Estimated Value
Home Financials for this Owner
Home Financials are based on the most recent Mortgage that was taken out on this home.
Original Mortgage
$63,460
Outstanding Balance
$60,823
Interest Rate
6.28%
Mortgage Type
FHA
Estimated Equity
$36,064
Purchase Details
Closed on
Apr 27, 2022
Sold by
D & D Properties Of Iowa Llc
Bought by
Mckee Amanda F
Home Financials for this Owner
Home Financials are based on the most recent Mortgage that was taken out on this home.
Original Mortgage
$73,641
Interest Rate
4.75%
Mortgage Type
FHA
Purchase Details
Closed on
Oct 23, 2018
Sold by
Sparks Ft
Bought by
D & D Properties Of Iowa
Purchase Details
Closed on
Mar 13, 2015
Sold by
Sparks Robert and Sparks Lu Zetta
Bought by
Sparks Family Declaration Of Trust
Create a Home Valuation Report for This Property
The Home Valuation Report is an in-depth analysis detailing your home's value as well as a comparison with similar homes in the area
Purchase History
| Date | Buyer | Sale Price | Title Company |
|---|---|---|---|
| Pecor Nina | $88,000 | None Listed On Document | |
| Mckee Amanda F | $75,000 | None Listed On Document | |
| D & D Properties Of Iowa | $24,000 | -- | |
| Sparks Family Declaration Of Trust | -- | None Available |
Source: Public Records
Mortgage History
| Date | Status | Borrower | Loan Amount |
|---|---|---|---|
| Open | Pecor Nina | $63,460 | |
| Previous Owner | Mckee Amanda F | $73,641 |
Source: Public Records
Tax History
| Year | Tax Paid | Tax Assessment Tax Assessment Total Assessment is a certain percentage of the fair market value that is determined by local assessors to be the total taxable value of land and additions on the property. | Land | Improvement |
|---|---|---|---|---|
| 2024 | $790 | $49,259 | $7,050 | $42,209 |
| 2023 | $744 | $0 | $0 | $0 |
| 2022 | $550 | $33,059 | $4,230 | $28,829 |
| 2021 | $576 | $33,059 | $4,230 | $28,829 |
| 2020 | $602 | $33,059 | $4,230 | $28,829 |
| 2019 | $602 | $32,794 | $0 | $0 |
| 2018 | $590 | $32,796 | $0 | $0 |
| 2017 | $590 | $31,234 | $0 | $0 |
| 2016 | $576 | $31,234 | $0 | $0 |
| 2015 | $544 | $27,640 | $0 | $0 |
| 2014 | $498 | $27,640 | $0 | $0 |
Source: Public Records
Map
Nearby Homes
Your Personal Tour Guide
Ask me questions while you tour the home.