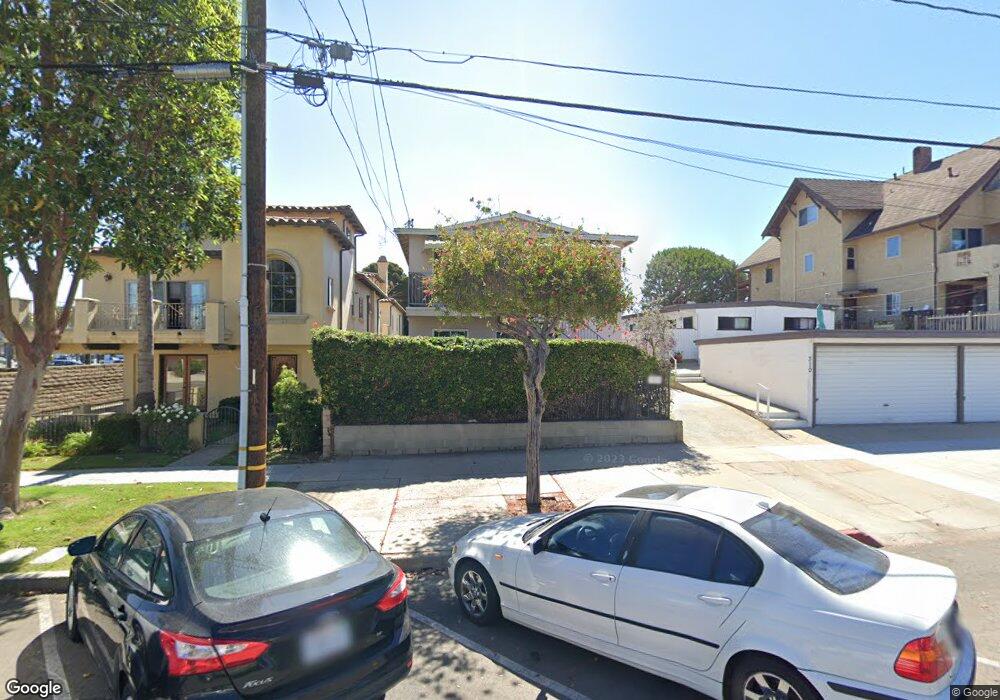
308 S Broadway Redondo Beach, CA 90277
Estimated Value: $1,898,000 - $2,212,000
4
Beds
4
Baths
2,160
Sq Ft
$943/Sq Ft
Est. Value
About This Home
This home is located at 308 S Broadway, Redondo Beach, CA 90277 and is currently estimated at $2,037,667, approximately $943 per square foot. 308 S Broadway is a home located in Los Angeles County with nearby schools including Alta Vista Elementary School, Parras (Nick G.) Middle School, and Redondo Union High School.
Ownership History
Date
Name
Owned For
Owner Type
Purchase Details
Closed on
Mar 15, 2018
Sold by
Cox Mary Elizabeth
Bought by
Cox Mary Elizabeth and James N & Mary E Cox Family Trust
Current Estimated Value
Purchase Details
Closed on
Dec 11, 2017
Sold by
Meek Homer L
Bought by
Meek Homer L and Meek Beverly
Purchase Details
Closed on
May 25, 2017
Sold by
Cox Mary Elizabeth
Bought by
Meek Homer Lynn and Cox Mary Elizabeth
Purchase Details
Closed on
Jun 21, 2002
Sold by
Meek Milton J
Bought by
Meek Milton Jefferis and Milton Jefferis Meek Living Trust
Purchase Details
Closed on
Dec 18, 2001
Sold by
Meek Homer L
Bought by
Meek Homer L and Meek Beverly
Purchase Details
Closed on
Dec 28, 2000
Sold by
Cox James Norwood
Bought by
Cox James Norwood and Cox Mary Elizabeth
Purchase Details
Closed on
Apr 27, 1994
Sold by
Meek Milton Jefferies
Bought by
Meek Milton J and Meek Margaret M
Create a Home Valuation Report for This Property
The Home Valuation Report is an in-depth analysis detailing your home's value as well as a comparison with similar homes in the area
Home Values in the Area
Average Home Value in this Area
Purchase History
| Date | Buyer | Sale Price | Title Company |
|---|---|---|---|
| Cox Mary Elizabeth | -- | None Available | |
| Meek Homer L | -- | None Available | |
| Meek Homer L | -- | None Available | |
| Meek Homer Lynn | -- | None Available | |
| Meek Homer Lynn | -- | None Available | |
| Meek Milton Jefferis | -- | -- | |
| Meek Milton J | -- | -- | |
| Meek Homer L | -- | -- | |
| Meek Homer L | -- | -- | |
| Cox James Norwood | -- | -- | |
| Cox James Norwood | -- | -- | |
| Meek Milton J | -- | -- |
Source: Public Records
Tax History Compared to Growth
Tax History
| Year | Tax Paid | Tax Assessment Tax Assessment Total Assessment is a certain percentage of the fair market value that is determined by local assessors to be the total taxable value of land and additions on the property. | Land | Improvement |
|---|---|---|---|---|
| 2025 | $9,433 | $780,275 | $304,200 | $476,075 |
| 2024 | $9,433 | $764,977 | $298,236 | $466,741 |
| 2023 | $9,274 | $749,979 | $292,389 | $457,590 |
| 2022 | $9,161 | $735,274 | $286,656 | $448,618 |
| 2021 | $9,114 | $720,858 | $281,036 | $439,822 |
| 2019 | $8,950 | $700,079 | $272,701 | $427,378 |
| 2018 | $8,656 | $686,364 | $267,354 | $419,010 |
| 2017 | $5,103 | $363,714 | $141,615 | $222,099 |
| 2016 | $5,009 | $356,584 | $138,839 | $217,745 |
| 2015 | $4,928 | $351,229 | $136,754 | $214,475 |
| 2014 | $4,897 | $344,350 | $134,076 | $210,274 |
Source: Public Records
Map
Nearby Homes
- 240 S Broadway Unit 2
- 240 S Broadway Unit 4
- 200 S Catalina Ave Unit 102
- 200 S Catalina Ave Unit 403
- 213 S Francisca Ave
- 211 S Francisca Ave Unit B
- 221 S Guadalupe Ave
- 694 The Village
- 531 Esplanade Unit 713
- 531 Esplanade Unit 903
- 512 Esplanade Unit 303
- 555 Esplanade Unit 520
- 555 Esplanade Unit 320
- 555 Esplanade Unit 620
- 220 S Helberta Ave Unit E
- 510 The Village Unit 103
- 520 The Village Unit 113
- 510 The Village Unit 203
- 520 The Village Unit 110
- 512 S Gertruda Ave
- 310 S Broadway
- 306 S Broadway
- 306 S Broadway Unit B
- 306 S Broadway Unit A
- 314 S Broadway
- 315 S Pacific Coast Hwy
- 316 S Broadway
- 316 S Broadway Unit B
- 316 S Broadway Unit A
- 321 S Pacific Coast Hwy
- 318 S Broadway
- 318 S Broadway Unit B
- 318 S Broadway Unit A
- 325 S Pacific Coast Hwy
- 327 S Pacific Coast Hwy
- 320 S Broadway Unit B
- 320 S Broadway Unit A
- 311 S Broadway Unit E
- 311 S Broadway Unit D
- 311 S Broadway Unit B