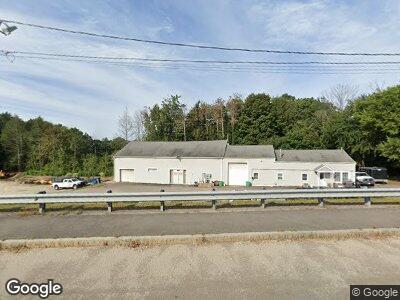
308 S Main St Bellingham, MA 02019
Estimated Value: $799,773
--
Bed
--
Bath
6,233
Sq Ft
$128/Sq Ft
Est. Value
About This Home
This home is located at 308 S Main St, Bellingham, MA 02019 and is currently estimated at $799,773, approximately $128 per square foot. 308 S Main St is a home located in Norfolk County with nearby schools including Joseph F. DiPietro Elementary, Bellingham High School, and Rise Prep Mayoral Academy Middle School.
Ownership History
Date
Name
Owned For
Owner Type
Purchase Details
Closed on
Jul 31, 2019
Sold by
Padre Realty Llc
Bought by
Lolas Rt
Current Estimated Value
Home Financials for this Owner
Home Financials are based on the most recent Mortgage that was taken out on this home.
Original Mortgage
$270,000
Outstanding Balance
$239,469
Interest Rate
3.8%
Mortgage Type
New Conventional
Estimated Equity
$567,913
Purchase Details
Closed on
Jan 24, 2003
Sold by
F & S Rt and Belland Robert P
Bought by
Padre Realty Llc
Home Financials for this Owner
Home Financials are based on the most recent Mortgage that was taken out on this home.
Original Mortgage
$292,000
Interest Rate
6.11%
Mortgage Type
Commercial
Purchase Details
Closed on
Jul 1, 1999
Sold by
Coon Tr David G
Bought by
Belland Tr Robert F and Belland Robert P
Home Financials for this Owner
Home Financials are based on the most recent Mortgage that was taken out on this home.
Original Mortgage
$112,500
Interest Rate
7.19%
Mortgage Type
Commercial
Create a Home Valuation Report for This Property
The Home Valuation Report is an in-depth analysis detailing your home's value as well as a comparison with similar homes in the area
Home Values in the Area
Average Home Value in this Area
Purchase History
| Date | Buyer | Sale Price | Title Company |
|---|---|---|---|
| Lolas Rt | $535,000 | -- | |
| Padre Realty Llc | $365,000 | -- | |
| Belland Tr Robert F | $149,900 | -- |
Source: Public Records
Mortgage History
| Date | Status | Borrower | Loan Amount |
|---|---|---|---|
| Open | Lolas Rt | $270,000 | |
| Closed | Lolas Rt | $216,000 | |
| Closed | Lolas Rt | $225,000 | |
| Previous Owner | Belland Tr Robert F | $150,000 | |
| Previous Owner | Padre Realty Llc | $335,000 | |
| Previous Owner | Padre Realty Llc | $292,000 | |
| Previous Owner | Belland Tr Robert F | $112,500 |
Source: Public Records
Tax History Compared to Growth
Tax History
| Year | Tax Paid | Tax Assessment Tax Assessment Total Assessment is a certain percentage of the fair market value that is determined by local assessors to be the total taxable value of land and additions on the property. | Land | Improvement |
|---|---|---|---|---|
| 2025 | $12,495 | $643,100 | $216,200 | $426,900 |
| 2024 | $10,523 | $568,200 | $152,600 | $415,600 |
| 2023 | $10,241 | $551,500 | $145,300 | $406,200 |
| 2022 | $10,169 | $506,400 | $132,500 | $373,900 |
| 2021 | $9,985 | $485,200 | $132,500 | $352,700 |
| 2020 | $9,699 | $471,300 | $131,500 | $339,800 |
| 2019 | $8,084 | $391,100 | $131,500 | $259,600 |
| 2018 | $7,675 | $368,800 | $125,200 | $243,600 |
| 2017 | $7,459 | $360,000 | $125,200 | $234,800 |
| 2016 | $7,053 | $341,700 | $125,800 | $215,900 |
| 2015 | $6,374 | $311,400 | $125,800 | $185,600 |
| 2014 | $5,375 | $300,100 | $121,000 | $179,100 |
Source: Public Records
Map
Nearby Homes
- 8 Bliss Rd
- 452 S Main St
- 1 Taft Dr
- 3 Dorena St
- 702 Rathbun St
- 101 Pine Grove Ave
- 660 S Main St
- 695 S Main St
- 7 Willow Brook Ln
- 20 Fox Run Rd Unit 20
- 7 Bucky Dr Unit 7
- 111 Harris Pond Rd
- 4 Diana St
- 0 Central Blvd
- 50 Montcalm Ave
- 21 Trenton St
- Lot 2 Pulaski Blvd
- 94 Lakeshore Dr
- 150 Garden St
- 194 Paine St