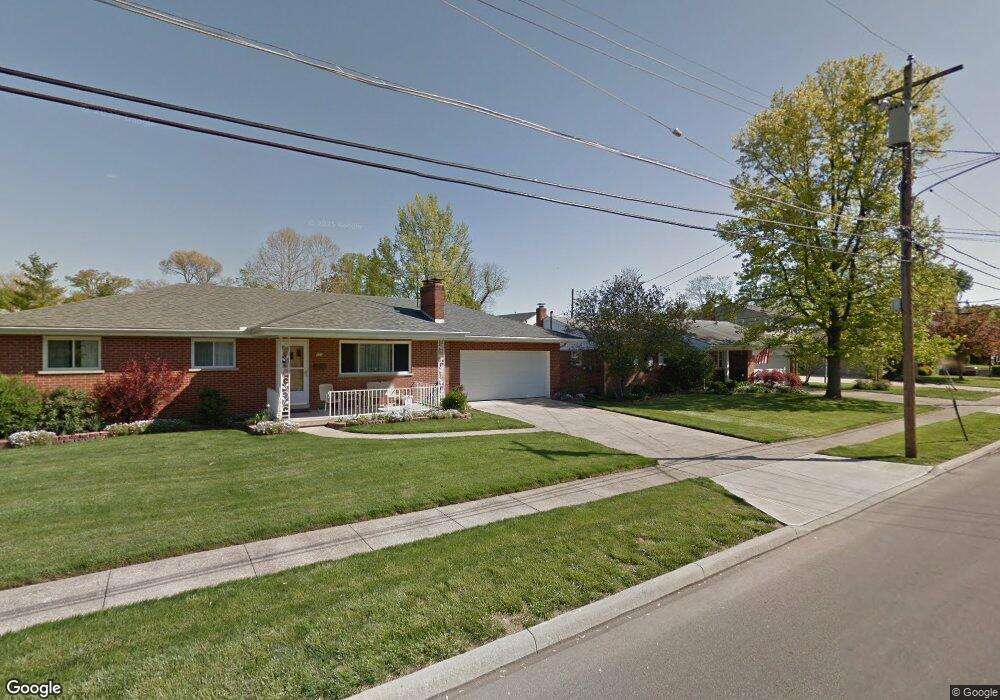
308 S Vine St Harrison, OH 45030
Estimated Value: $255,000 - $354,000
4
Beds
3
Baths
2,158
Sq Ft
$145/Sq Ft
Est. Value
About This Home
This home is located at 308 S Vine St, Harrison, OH 45030 and is currently estimated at $313,106, approximately $145 per square foot. 308 S Vine St is a home located in Hamilton County with nearby schools including William Henry Harrison High School, St. John The Baptist School, and Summit Academy of Southwest Ohio.
Ownership History
Date
Name
Owned For
Owner Type
Purchase Details
Closed on
Jul 24, 2017
Sold by
Houston Cindy L and Houston Arthur C
Bought by
Houston Cindy L and Houston Arthur C
Current Estimated Value
Home Financials for this Owner
Home Financials are based on the most recent Mortgage that was taken out on this home.
Original Mortgage
$155,677
Outstanding Balance
$76,608
Interest Rate
2.87%
Mortgage Type
FHA
Estimated Equity
$236,498
Purchase Details
Closed on
Mar 12, 2004
Sold by
Green Harry J and Metzler Joann
Bought by
Hochscheid Cindy L and Houston Jr Arthur C
Home Financials for this Owner
Home Financials are based on the most recent Mortgage that was taken out on this home.
Original Mortgage
$161,000
Interest Rate
5.78%
Mortgage Type
Unknown
Purchase Details
Closed on
Feb 25, 1998
Sold by
Meyer Builders Douglas Homes Ltd
Bought by
Green Harry J and Metzler Joann
Purchase Details
Closed on
Oct 10, 1997
Sold by
Grieshop Enterprises Inc
Bought by
Meyer Builders Douglas Homes Ltd
Create a Home Valuation Report for This Property
The Home Valuation Report is an in-depth analysis detailing your home's value as well as a comparison with similar homes in the area
Home Values in the Area
Average Home Value in this Area
Purchase History
| Date | Buyer | Sale Price | Title Company |
|---|---|---|---|
| Houston Cindy L | -- | None Available | |
| Hochscheid Cindy L | $161,000 | -- | |
| Green Harry J | $137,400 | -- | |
| Meyer Builders Douglas Homes Ltd | $18,500 | -- |
Source: Public Records
Mortgage History
| Date | Status | Borrower | Loan Amount |
|---|---|---|---|
| Open | Houston Cindy L | $155,677 | |
| Closed | Hochscheid Cindy L | $161,000 |
Source: Public Records
Tax History
| Year | Tax Paid | Tax Assessment Tax Assessment Total Assessment is a certain percentage of the fair market value that is determined by local assessors to be the total taxable value of land and additions on the property. | Land | Improvement |
|---|---|---|---|---|
| 2025 | $4,488 | $100,457 | $10,080 | $90,377 |
| 2023 | $4,502 | $100,457 | $10,080 | $90,377 |
| 2022 | $3,718 | $72,643 | $10,080 | $62,563 |
| 2021 | $3,548 | $70,123 | $10,080 | $60,043 |
| 2020 | $3,590 | $70,123 | $10,080 | $60,043 |
| 2019 | $3,128 | $58,436 | $8,400 | $50,036 |
| 2018 | $3,146 | $58,436 | $8,400 | $50,036 |
| 2017 | $2,967 | $58,436 | $8,400 | $50,036 |
| 2016 | $2,726 | $58,132 | $7,980 | $50,152 |
| 2015 | $2,759 | $58,132 | $7,980 | $50,152 |
| 2014 | $2,630 | $58,132 | $7,980 | $50,152 |
| 2013 | $2,788 | $61,191 | $8,400 | $52,791 |
Source: Public Records
Map
Nearby Homes
- 119 Park Ave
- 300 Whitewater Dr
- 219 N Walnut St
- 163 Turner Ridge Dr
- 117 Westfield Dr
- 120 Westfield Dr
- 157 Turner Ridge Dr
- 155 Turner Ridge Dr
- 143 Flintstone Dr
- 207 Biddle Ave
- 10419 New Biddinger Rd
- 23 Harrison Brookville Rd
- 11136 New Biddinger Rd
- 483 Heritage Square
- 398 Legacy Way
- 10803 Stone Ridge Way Unit 15
- 10630 New Biddinger Rd
- 10638 New Biddinger Rd
- 449 Lyness Ave
- 10648 New Biddinger Rd
Your Personal Tour Guide
Ask me questions while you tour the home.