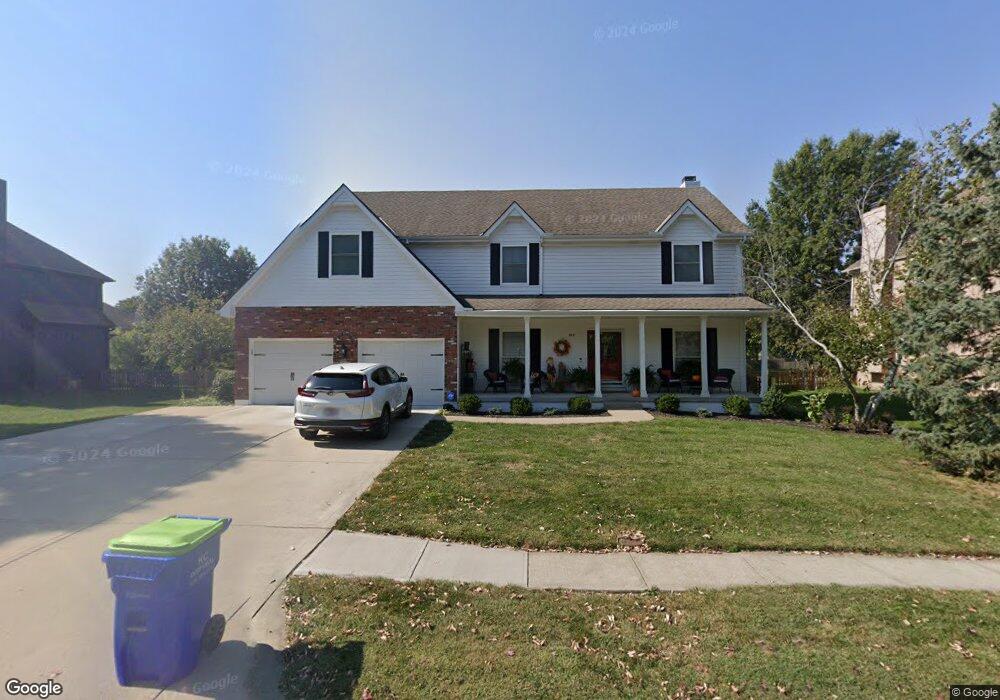
308 SE Canterbury Ln Lees Summit, MO 64063
Estimated Value: $412,384 - $521,000
4
Beds
3
Baths
2,420
Sq Ft
$186/Sq Ft
Est. Value
About This Home
This home is located at 308 SE Canterbury Ln, Lees Summit, MO 64063 and is currently estimated at $450,096, approximately $185 per square foot. 308 SE Canterbury Ln is a home located in Jackson County with nearby schools including Highland Park Elementary School, Pleasant Lea Middle School, and Lee's Summit Senior High School.
Ownership History
Date
Name
Owned For
Owner Type
Purchase Details
Closed on
Jul 29, 1996
Sold by
Decker Brian C and Decker Donna L
Bought by
Smitka John J and Smitka Christina L
Current Estimated Value
Home Financials for this Owner
Home Financials are based on the most recent Mortgage that was taken out on this home.
Original Mortgage
$120,000
Interest Rate
8.41%
Mortgage Type
Balloon
Purchase Details
Closed on
Mar 11, 1996
Sold by
Dill Breon Dev Inc
Bought by
Decker Brian C and Decker Donna L
Home Financials for this Owner
Home Financials are based on the most recent Mortgage that was taken out on this home.
Original Mortgage
$120,000
Interest Rate
7.03%
Mortgage Type
Purchase Money Mortgage
Purchase Details
Closed on
Aug 28, 1995
Sold by
Mcgovern Builders Inc
Bought by
Dill Breon Dev Inc
Create a Home Valuation Report for This Property
The Home Valuation Report is an in-depth analysis detailing your home's value as well as a comparison with similar homes in the area
Home Values in the Area
Average Home Value in this Area
Purchase History
| Date | Buyer | Sale Price | Title Company |
|---|---|---|---|
| Smitka John J | -- | -- | |
| Decker Brian C | -- | Coffelt Land Title Inc | |
| Dill Breon Dev Inc | -- | Coffelt Land Title Inc |
Source: Public Records
Mortgage History
| Date | Status | Borrower | Loan Amount |
|---|---|---|---|
| Closed | Smitka John J | $120,000 | |
| Previous Owner | Decker Brian C | $120,000 |
Source: Public Records
Tax History Compared to Growth
Tax History
| Year | Tax Paid | Tax Assessment Tax Assessment Total Assessment is a certain percentage of the fair market value that is determined by local assessors to be the total taxable value of land and additions on the property. | Land | Improvement |
|---|---|---|---|---|
| 2025 | $4,870 | $68,598 | $16,547 | $52,051 |
| 2024 | $4,870 | $67,450 | $8,231 | $59,219 |
| 2023 | $5,913 | $82,483 | $10,686 | $71,797 |
| 2022 | $4,187 | $51,870 | $7,211 | $44,659 |
| 2021 | $4,274 | $51,870 | $7,211 | $44,659 |
| 2020 | $4,111 | $49,413 | $7,211 | $42,202 |
| 2019 | $3,999 | $49,413 | $7,211 | $42,202 |
| 2018 | $3,719 | $42,639 | $4,166 | $38,473 |
| 2017 | $3,719 | $42,639 | $4,166 | $38,473 |
| 2016 | $3,671 | $41,659 | $6,850 | $34,809 |
| 2014 | $3,635 | $40,445 | $6,650 | $33,795 |
Source: Public Records
Map
Nearby Homes
- 214 SE Windsboro Ct
- 354 SE Wood Ln
- 304 SE Wood Ln
- 2901 SE Bingham Dr
- 201 SE Somerset Dr
- 321 SE Golden Ln
- 2433 SE 6th St
- 2403 SE 5th Terrace
- 416 SE Stillwater Ct
- 428 SE Ashton Dr
- 2504 NE Woodland Oak Cir
- 2316 SE 6th St
- 436 SE Ashton Dr
- 258 SE Topaz Cir
- 2112 SE 3rd St
- 633 SE Athens Dr
- 416 NE Bitter Creek Rd
- 2123 SE 5th St
- 23808 E Langsford Rd
- 514 NE Viewpark Dr
- 304 SE Canterbury Ln
- 312 SE Canterbury Ln
- 309 SE Canterbury Ln
- 305 SE Canterbury Ln
- 2609 SE 3rd St
- 400 SE Youngston Ln
- 301 SE Canterbury Ln
- 317 SE Canterbury Ln
- 321 SE Canterbury Ln
- 2601 SE 3rd St
- 408 SE Youngston Ln
- 2608 SE 3rd St
- 2612 SE 3rd St
- 222 SE Windsboro Ct
- 325 SE Canterbury Ln
- 304 SE Bingham Dr
- 300 SE Bingham Dr
- 308 SE Bingham Dr
- 412 SE Youngston Ln
- 2616 SE 3rd St