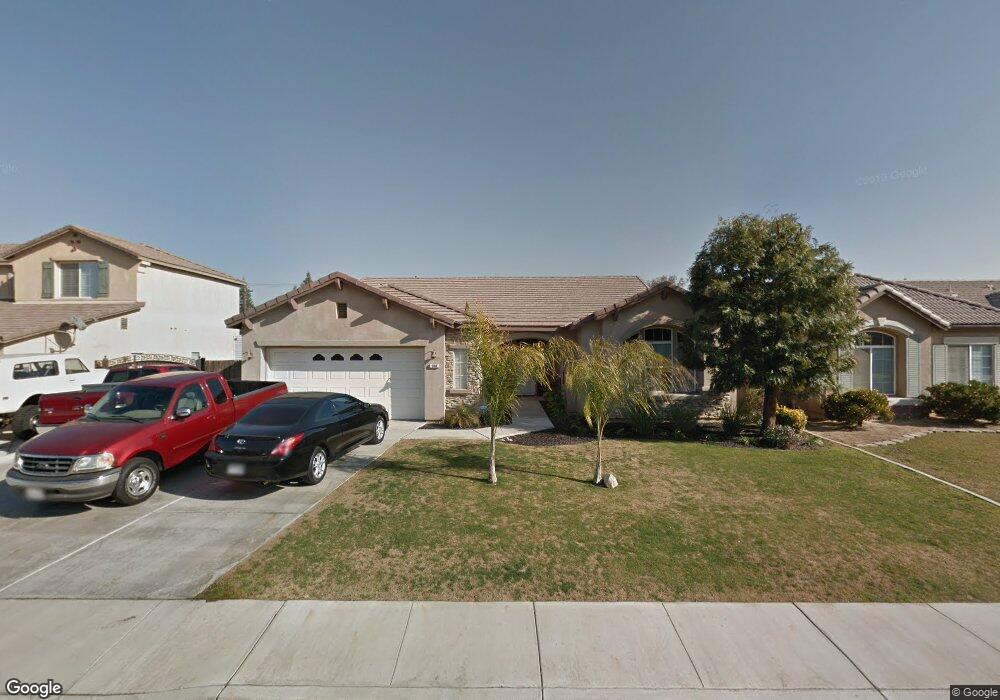
308 Sonoma Vine Ct Bakersfield, CA 93314
Estimated Value: $503,383 - $554,000
3
Beds
2
Baths
2,541
Sq Ft
$207/Sq Ft
Est. Value
About This Home
This home is located at 308 Sonoma Vine Ct, Bakersfield, CA 93314 and is currently estimated at $526,346, approximately $207 per square foot. 308 Sonoma Vine Ct is a home located in Kern County with nearby schools including Del Rio Elementary School, Rosedale Middle School, and Liberty High School.
Ownership History
Date
Name
Owned For
Owner Type
Purchase Details
Closed on
Aug 2, 2010
Sold by
Hennion Erik R
Bought by
Romero Robert O and Romero Maria G
Current Estimated Value
Home Financials for this Owner
Home Financials are based on the most recent Mortgage that was taken out on this home.
Original Mortgage
$212,143
Outstanding Balance
$146,889
Interest Rate
5.5%
Mortgage Type
FHA
Estimated Equity
$379,457
Purchase Details
Closed on
Feb 6, 2006
Sold by
Lennar Homes Of California Inc
Bought by
Hennion Erik R
Home Financials for this Owner
Home Financials are based on the most recent Mortgage that was taken out on this home.
Original Mortgage
$331,176
Interest Rate
1%
Mortgage Type
Negative Amortization
Purchase Details
Closed on
Jan 26, 2006
Sold by
Hennion Anabela
Bought by
Hennion Erik R
Home Financials for this Owner
Home Financials are based on the most recent Mortgage that was taken out on this home.
Original Mortgage
$331,176
Interest Rate
1%
Mortgage Type
Negative Amortization
Create a Home Valuation Report for This Property
The Home Valuation Report is an in-depth analysis detailing your home's value as well as a comparison with similar homes in the area
Home Values in the Area
Average Home Value in this Area
Purchase History
| Date | Buyer | Sale Price | Title Company |
|---|---|---|---|
| Romero Robert O | $215,000 | Chicago Title Company | |
| Hennion Erik R | $414,000 | None Available | |
| Hennion Erik R | -- | None Available |
Source: Public Records
Mortgage History
| Date | Status | Borrower | Loan Amount |
|---|---|---|---|
| Open | Romero Robert O | $212,143 | |
| Previous Owner | Hennion Erik R | $331,176 | |
| Previous Owner | Hennion Erik R | $41,397 |
Source: Public Records
Tax History Compared to Growth
Tax History
| Year | Tax Paid | Tax Assessment Tax Assessment Total Assessment is a certain percentage of the fair market value that is determined by local assessors to be the total taxable value of land and additions on the property. | Land | Improvement |
|---|---|---|---|---|
| 2025 | $4,449 | $275,442 | $76,865 | $198,577 |
| 2024 | $4,350 | $270,042 | $75,358 | $194,684 |
| 2023 | $4,350 | $264,748 | $73,881 | $190,867 |
| 2022 | $4,266 | $259,558 | $72,433 | $187,125 |
| 2021 | $4,139 | $254,469 | $71,013 | $183,456 |
| 2020 | $4,067 | $251,860 | $70,285 | $181,575 |
| 2019 | $3,997 | $251,860 | $70,285 | $181,575 |
| 2018 | $3,908 | $242,081 | $67,556 | $174,525 |
| 2017 | $3,848 | $237,335 | $66,232 | $171,103 |
| 2016 | $3,653 | $232,683 | $64,934 | $167,749 |
| 2015 | $3,593 | $229,189 | $63,959 | $165,230 |
| 2014 | $3,517 | $224,701 | $62,707 | $161,994 |
Source: Public Records
Map
Nearby Homes
- 309 Sonoma Vine Ct
- 1215 Brookline Ln
- 214 Irish Crystal Ct
- 14620 Sunnybank Ave
- 205 Calle Avenida
- 118 Emerald Isle Way
- 304 Calle Lechuga
- 14616 Tralee Dr
- 18 Claudia Autumn Dr
- 14016 Las Entradas
- 15112 Sunnybank Ave
- 14008 Las Entradas
- 15 Claudia Autumn Dr
- 14308 San Jose Ave
- 14710 Huckleberry Dr
- 13904 Las Entradas
- 14448 Kathleen Ave
- 14708 Lemon Lily Dr
- 14716 Lemon Lily Dr
- 15401 Mabel Ct
- 312 Sonoma Vine Ct
- 304 Sonoma Vine Ct
- 316 Sonoma Vine Ct
- 300 Sonoma Vine Ct
- 313 Sonoma Vine Ct
- 320 Sonoma Vine Ct
- 317 Sonoma Vine Ct
- 305 Sonoma Vine Ct
- 321 Sonoma Vine Ct
- 306 Renfro Rd
- 320 Renfro Rd
- 324 Sonoma Vine Ct
- 340 Renfro Rd
- 306 Pine Falls Dr
- 302 Pine Falls Dr
- 310 Pine Falls Dr
- 14600 Central Coast St
- 314 Pine Falls Dr
- 14703 Merlot Cellars Dr
- 14604 Central Coast St