Estimated Value: $499,473 - $563,000
4
Beds
3
Baths
3,105
Sq Ft
$170/Sq Ft
Est. Value
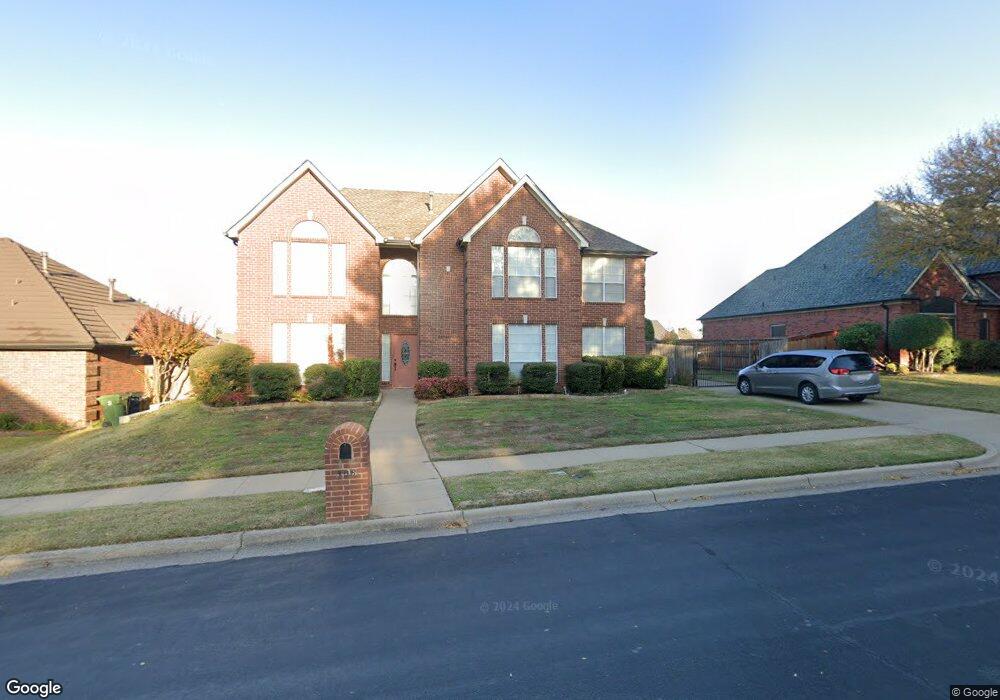
About This Home
This home is located at 308 Springhill Dr, Hurst, TX 76054 and is currently estimated at $528,618, approximately $170 per square foot. 308 Springhill Dr is a home located in Tarrant County with nearby schools including Bransford Elementary School, Colleyville Middle School, and Grapevine High School.
Ownership History
Date
Name
Owned For
Owner Type
Purchase Details
Closed on
Feb 12, 2021
Sold by
Wsc Family Properties Llc
Bought by
Crowder William and Crowder Sujata
Current Estimated Value
Home Financials for this Owner
Home Financials are based on the most recent Mortgage that was taken out on this home.
Original Mortgage
$168,900
Outstanding Balance
$150,932
Interest Rate
2.65%
Mortgage Type
New Conventional
Estimated Equity
$377,686
Purchase Details
Closed on
May 15, 2014
Sold by
Crowder William J and Crowder Sujata G
Bought by
Wsc Family Properties Llc
Purchase Details
Closed on
Feb 26, 2013
Sold by
Pan Chung Ta Alfred and Goan Kim
Bought by
Crowder William J and Crowder Sujata G
Home Financials for this Owner
Home Financials are based on the most recent Mortgage that was taken out on this home.
Original Mortgage
$192,000
Interest Rate
3.44%
Mortgage Type
New Conventional
Create a Home Valuation Report for This Property
The Home Valuation Report is an in-depth analysis detailing your home's value as well as a comparison with similar homes in the area
Home Values in the Area
Average Home Value in this Area
Purchase History
| Date | Buyer | Sale Price | Title Company |
|---|---|---|---|
| Crowder William | -- | Juniper Title | |
| Wsc Family Properties Llc | -- | Juniper Title Inc | |
| Crowder William | -- | Juniper Title | |
| Wsc Family Properties Llc | -- | None Available | |
| Crowder William J | -- | First American Title |
Source: Public Records
Mortgage History
| Date | Status | Borrower | Loan Amount |
|---|---|---|---|
| Open | Crowder William | $168,900 | |
| Closed | Crowder William | $168,900 | |
| Previous Owner | Crowder William J | $192,000 |
Source: Public Records
Tax History
| Year | Tax Paid | Tax Assessment Tax Assessment Total Assessment is a certain percentage of the fair market value that is determined by local assessors to be the total taxable value of land and additions on the property. | Land | Improvement |
|---|---|---|---|---|
| 2025 | $5,454 | $448,477 | $85,000 | $363,477 |
| 2024 | $5,454 | $508,000 | $85,000 | $423,000 |
| 2023 | $10,524 | $524,359 | $85,000 | $439,359 |
| 2022 | $9,259 | $398,493 | $55,000 | $343,493 |
| 2021 | $10,029 | $398,493 | $55,000 | $343,493 |
| 2020 | $8,040 | $320,000 | $55,000 | $265,000 |
| 2019 | $8,228 | $320,000 | $55,000 | $265,000 |
| 2017 | $9,450 | $361,896 | $55,000 | $306,896 |
| 2016 | $8,182 | $313,355 | $40,000 | $273,355 |
Source: Public Records
Map
Nearby Homes
- 104 Greenbriar Ln
- 2620 Brookridge Dr
- 2925 Ridgewood Dr
- 3716 Sweetbriar Ln
- 3121 Oakdale Dr
- 4108 Wellington Dr
- 712 Springhill Dr
- 736 Springhill Dr
- 4900 Rockrimmon Ct
- 504 Bridlewood N
- 717 Ashley Dr
- 753 Toni Dr
- 3220 David Dr
- 6812 Switchback Trail
- 108 Glade Rd
- 112 Glade Rd
- 3229 David Dr
- 6704 Nob Hill Ct
- 6708 Nob Hill Ct
- 9120 Nob Hill Dr
- 312 Springhill Dr
- 304 Springhill Dr
- 2816 Mesa Ct
- 2820 Mesa Ct
- 2812 Mesa Ct
- 316 Springhill Dr
- 309 Springhill Dr
- 313 Springhill Dr
- 300 Springhill Dr
- 305 Springhill Dr
- 2808 Mesa Ct
- 317 Springhill Dr
- 2824 Mesa Ct
- 2805 Walnut Ln
- 301 Springhill Dr
- 320 Springhill Dr
- 321 Springhill Dr
- 2804 Mesa Ct
- 308 Brazil Dr
- 304 Brazil Dr
Your Personal Tour Guide
Ask me questions while you tour the home.