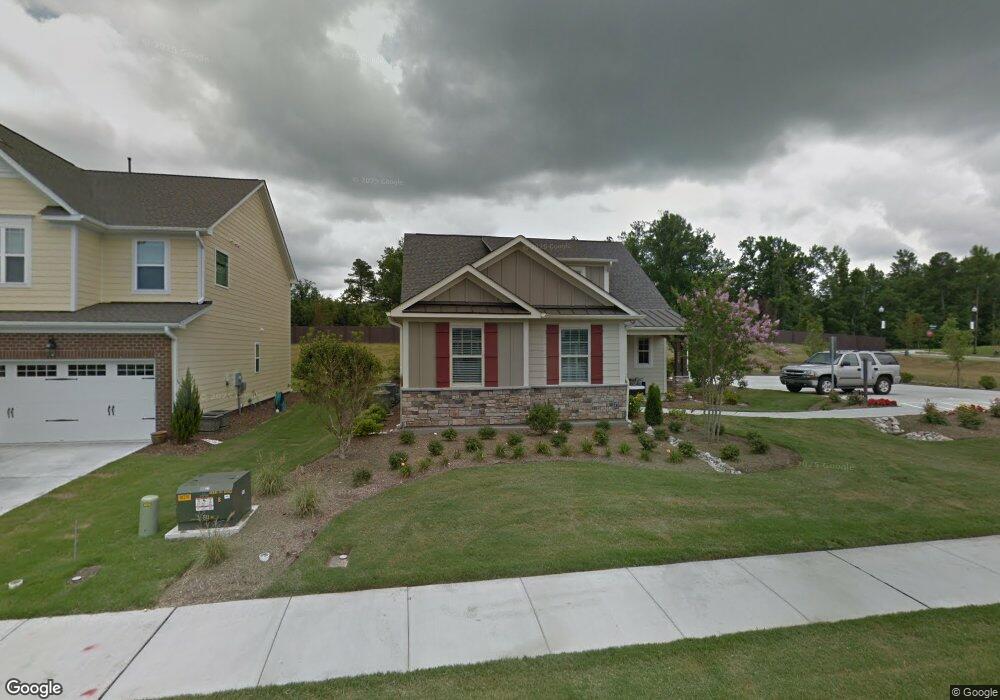
308 Springtime Fields Ln Wake Forest, NC 27587
Estimated Value: $515,000 - $575,000
4
Beds
3
Baths
2,392
Sq Ft
$225/Sq Ft
Est. Value
About This Home
This home is located at 308 Springtime Fields Ln, Wake Forest, NC 27587 and is currently estimated at $539,202, approximately $225 per square foot. 308 Springtime Fields Ln is a home located in Wake County with nearby schools including Richland Creek Elementary School, Wake Forest-Rolesville Middle School, and Wake Forest High School.
Ownership History
Date
Name
Owned For
Owner Type
Purchase Details
Closed on
Aug 3, 2020
Sold by
Dibenedetto Susan E and Dibenedetto Derek J
Bought by
Meza Steven and Meza Lindsay
Current Estimated Value
Home Financials for this Owner
Home Financials are based on the most recent Mortgage that was taken out on this home.
Original Mortgage
$375,250
Outstanding Balance
$333,488
Interest Rate
3.1%
Mortgage Type
New Conventional
Estimated Equity
$205,714
Purchase Details
Closed on
Jun 27, 2017
Sold by
Stanley Marian M
Bought by
Dibenedetto Susan E and Gottlich Derek J
Home Financials for this Owner
Home Financials are based on the most recent Mortgage that was taken out on this home.
Original Mortgage
$260,000
Interest Rate
4.05%
Mortgage Type
New Conventional
Purchase Details
Closed on
Jul 3, 2013
Sold by
M I Homes Of Raleigh Llc
Bought by
Stanley Dwight M and Stanley Marian M
Create a Home Valuation Report for This Property
The Home Valuation Report is an in-depth analysis detailing your home's value as well as a comparison with similar homes in the area
Home Values in the Area
Average Home Value in this Area
Purchase History
| Date | Buyer | Sale Price | Title Company |
|---|---|---|---|
| Meza Steven | $395,000 | None Available | |
| Dibenedetto Susan E | $325,000 | None Available | |
| Stanley Dwight M | $319,000 | None Available |
Source: Public Records
Mortgage History
| Date | Status | Borrower | Loan Amount |
|---|---|---|---|
| Open | Meza Steven | $375,250 | |
| Previous Owner | Dibenedetto Susan E | $260,000 |
Source: Public Records
Tax History
| Year | Tax Paid | Tax Assessment Tax Assessment Total Assessment is a certain percentage of the fair market value that is determined by local assessors to be the total taxable value of land and additions on the property. | Land | Improvement |
|---|---|---|---|---|
| 2025 | $5,293 | $549,816 | $100,000 | $449,816 |
| 2024 | $5,274 | $549,816 | $100,000 | $449,816 |
Source: Public Records
Map
Nearby Homes
- 1015 Wait Ave
- 1014 Tranquil Creek Way
- 1019 Tranquil Creek Way
- 916 Conifer Forest Ln
- 518 Oak Forest View Ln
- 506 Oak Forest View Ln
- 1104 Touchstone Way
- 518 Retreat Ln
- 1200 Touchstone Way
- 498 Traditions Grande Blvd Unit 23
- 498 Traditions Grande Blvd
- 123 Stone Park Dr
- 111 Stone Park Dr
- 978 Gateway Commons Cir
- 816 Wildflower Ridge Rd
- 515 Traditions Grande Blvd
- 520 Traditions Grande Blvd Unit 15
- 520 Traditions Grande Blvd
- 0 Carroll St
- 522 Traditions Grande Blvd Unit 14
- 304 Springtime Fields Ln
- 316 Springtime Fields Ln
- 300 Springtime Fields Ln
- 309 Springtime Fields Ln
- 320 Springtime Fields Ln
- 313 Springtime Fields Ln
- 305 Springtime Fields Ln
- 317 Springtime Fields Ln
- 1032 Traditions Meadow Dr
- 301 Springtime Fields Ln
- 324 Springtime Fields Ln
- 232 Springtime Fields Ln
- 1005 Lemongrass Ln
- 1028 Traditions Meadow Dr
- 1105 Grande Water Way Unit 9
- 328 Springtime Fields Ln
- 321 Springtime Fields Ln
- 233 Springtime Fields Ln
- 228 Springtime Fields Ln
- 325 Springtime Fields Ln
Your Personal Tour Guide
Ask me questions while you tour the home.