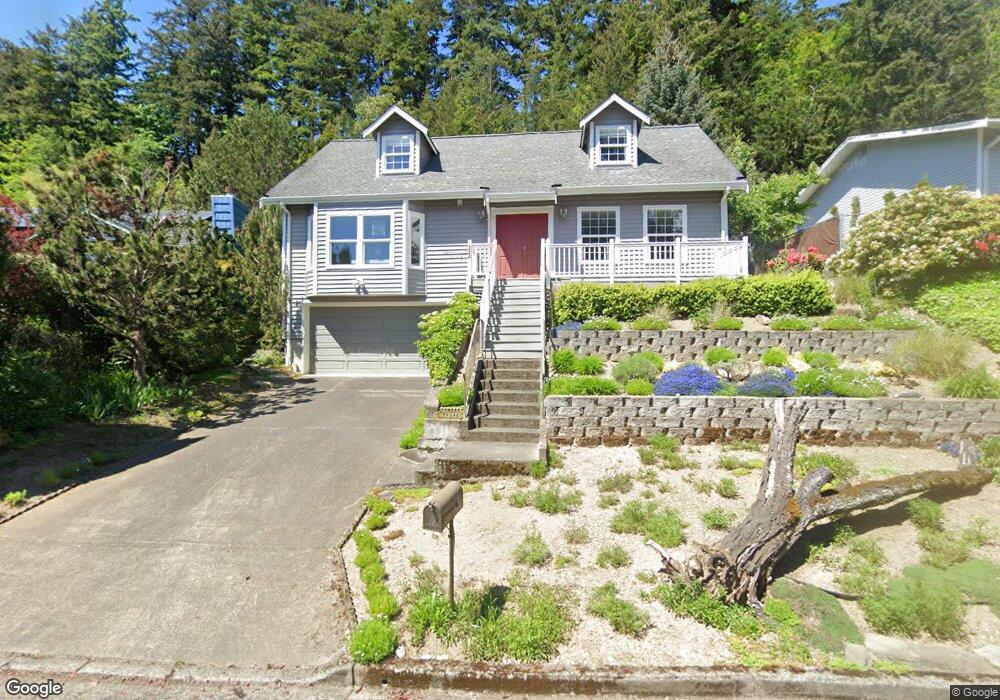
308 Willow Ct N Bellingham, WA 98225
Edgemoor NeighborhoodEstimated Value: $859,000 - $1,332,000
3
Beds
4
Baths
2,860
Sq Ft
$368/Sq Ft
Est. Value
About This Home
This home is located at 308 Willow Ct N, Bellingham, WA 98225 and is currently estimated at $1,053,809, approximately $368 per square foot. 308 Willow Ct N is a home located in Whatcom County with nearby schools including Happy Valley Elementary School, Fairhaven Middle School, and Sehome High School.
Ownership History
Date
Name
Owned For
Owner Type
Purchase Details
Closed on
Jul 19, 2011
Sold by
Mccann Fergus
Bought by
Mccann Bernice E
Current Estimated Value
Purchase Details
Closed on
Nov 19, 2010
Sold by
Rosinski Christopher J
Bought by
Rosinski Christopher J and Rosinski Ashlea A Shepherd
Home Financials for this Owner
Home Financials are based on the most recent Mortgage that was taken out on this home.
Original Mortgage
$322,500
Interest Rate
4.16%
Mortgage Type
New Conventional
Purchase Details
Closed on
Oct 21, 1999
Sold by
Holden Charles C and Holden Valentine
Bought by
Rosinski Christopher J
Home Financials for this Owner
Home Financials are based on the most recent Mortgage that was taken out on this home.
Original Mortgage
$147,520
Interest Rate
7.75%
Create a Home Valuation Report for This Property
The Home Valuation Report is an in-depth analysis detailing your home's value as well as a comparison with similar homes in the area
Home Values in the Area
Average Home Value in this Area
Purchase History
| Date | Buyer | Sale Price | Title Company |
|---|---|---|---|
| Mccann Bernice E | $342,099 | Chicago Title Insurance | |
| Mccann Bernice E | $346,780 | Chicago Title Insurance | |
| Rosinski Christopher J | -- | Whatcom Land Title | |
| Rosinski Christopher J | $184,400 | Chicago Title Insurance Co |
Source: Public Records
Mortgage History
| Date | Status | Borrower | Loan Amount |
|---|---|---|---|
| Previous Owner | Rosinski Christopher J | $322,500 | |
| Previous Owner | Rosinski Christopher J | $147,520 |
Source: Public Records
Tax History Compared to Growth
Tax History
| Year | Tax Paid | Tax Assessment Tax Assessment Total Assessment is a certain percentage of the fair market value that is determined by local assessors to be the total taxable value of land and additions on the property. | Land | Improvement |
|---|---|---|---|---|
| 2024 | $6,436 | $798,566 | $304,092 | $494,474 |
| 2023 | $6,436 | $827,116 | $314,964 | $512,152 |
| 2022 | $5,299 | $703,933 | $268,056 | $435,877 |
| 2021 | $5,035 | $567,703 | $216,180 | $351,523 |
| 2020 | $4,947 | $497,981 | $189,630 | $308,351 |
| 2019 | $4,825 | $472,692 | $180,000 | $292,692 |
| 2018 | $4,989 | $462,350 | $162,208 | $300,142 |
| 2017 | $4,402 | $410,400 | $143,980 | $266,420 |
| 2016 | $4,008 | $377,955 | $132,480 | $245,475 |
| 2015 | $3,945 | $358,488 | $125,580 | $232,908 |
| 2014 | -- | $341,408 | $119,600 | $221,808 |
| 2013 | -- | $324,450 | $115,000 | $209,450 |
Source: Public Records
Map
Nearby Homes
- 331 Chuckanut Dr N
- 425 Chuckanut Dr N Unit 5
- 1301 Broad St
- 2600 16th St
- 507 Lyla Ln
- 404 Willow Road Place
- 406 Willow Road Place
- 505 Willow Rd
- 1212 Old Fairhaven Pkwy Unit D202
- 214 Bayside Rd
- 1302 Larrabee Ave
- 624 Clark Rd
- 1605 Donovan Ave
- 707 Donovan Ave
- 1902 Wilson Ave
- 405 Bayside Rd
- 910 Harris Ave Unit 208
- 910 Harris Ave Unit 304
- 671 Chuckanut Dr N
- 1315 Mill Ave
- 306 Willow Ct N
- 310 Willow Ct N
- 304 Willow Ct N
- 312 Willow Ct N
- 314 Willow Ct N
- 315 Parkridge Rd
- 302 Willow Ct N
- 307 Willow Ct N
- 311 Parkridge Rd
- 305 Willow Ct N
- 300 Willow Ct N
- 300 Willow Ct N
- 317 Park Ridge Rd
- 309 Willow Ct N
- 301 Willow Ct N
- 303 Willow Ct N
- 316 Willow Ct N
- 703 Willow Rd
- 321 Park Ridge Rd
- 705 Willow Rd