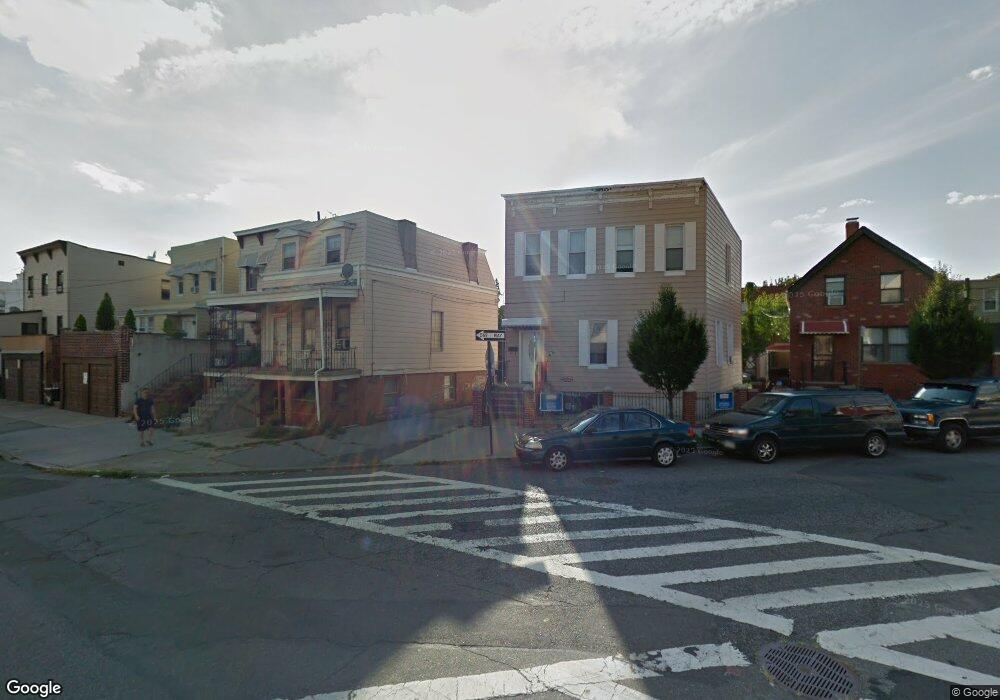
3080 42nd St Astoria, NY 11103
Astoria NeighborhoodEstimated Value: $1,082,269 - $1,546,000
--
Bed
--
Bath
1,545
Sq Ft
$845/Sq Ft
Est. Value
About This Home
This home is located at 3080 42nd St, Astoria, NY 11103 and is currently estimated at $1,305,567, approximately $845 per square foot. 3080 42nd St is a home located in Queens County with nearby schools including I.S. 010 Horace Greeley, William Cullen Bryant High School, and Our World Neighborhood Charter School.
Ownership History
Date
Name
Owned For
Owner Type
Purchase Details
Closed on
Aug 29, 2017
Sold by
The Expense Group Corp
Bought by
M & M 3080 Llc
Current Estimated Value
Purchase Details
Closed on
May 19, 2017
Sold by
Ann Loose Linda and Loose Edward
Bought by
The Expense Group Corp
Purchase Details
Closed on
Mar 9, 2017
Sold by
Estate Of Allan Wilson
Bought by
The Expense Group Corp
Purchase Details
Closed on
Mar 7, 2017
Sold by
Dyba Mabel
Bought by
The Expense Group Corp
Purchase Details
Closed on
Feb 3, 2017
Sold by
Estate Of Mabel Loose Wilson Jr and Jean Wilson Jacobs Barbara
Bought by
The Expense Group Crop
Purchase Details
Closed on
Jan 19, 2017
Sold by
Christine Pino Amy
Bought by
The Expense Group Corp
Purchase Details
Closed on
Dec 12, 2016
Sold by
Daniella O'Brien Stephanie
Bought by
The Expense Group Llc
Create a Home Valuation Report for This Property
The Home Valuation Report is an in-depth analysis detailing your home's value as well as a comparison with similar homes in the area
Home Values in the Area
Average Home Value in this Area
Purchase History
| Date | Buyer | Sale Price | Title Company |
|---|---|---|---|
| M & M 3080 Llc | $870,000 | -- | |
| The Expense Group Corp | $70,000 | -- | |
| The Expense Group Corp | $81,000 | -- | |
| The Expense Group Corp | $6,000 | -- | |
| The Expense Group Corp | $40,000 | -- | |
| The Expense Group Crop | $10,000 | -- | |
| The Expense Group Corp | $25,000 | -- | |
| The Expense Group Llc | $73,000 | -- |
Source: Public Records
Tax History Compared to Growth
Tax History
| Year | Tax Paid | Tax Assessment Tax Assessment Total Assessment is a certain percentage of the fair market value that is determined by local assessors to be the total taxable value of land and additions on the property. | Land | Improvement |
|---|---|---|---|---|
| 2025 | $8,204 | $43,282 | $13,444 | $29,838 |
| 2024 | $8,204 | $40,846 | $11,923 | $28,923 |
| 2023 | $7,772 | $38,695 | $9,988 | $28,707 |
| 2022 | $7,725 | $75,720 | $18,600 | $57,120 |
| 2021 | $8,045 | $73,560 | $18,600 | $54,960 |
| 2020 | $7,635 | $72,180 | $18,600 | $53,580 |
| 2019 | $7,120 | $70,620 | $18,600 | $52,020 |
| 2018 | $6,573 | $32,246 | $7,265 | $24,981 |
| 2017 | $6,573 | $32,246 | $9,966 | $22,280 |
| 2016 | $6,368 | $32,246 | $9,966 | $22,280 |
| 2015 | $3,669 | $30,057 | $12,765 | $17,292 |
| 2014 | $3,669 | $28,365 | $14,456 | $13,909 |
Source: Public Records
Map
Nearby Homes
- 30-77 42nd St
- 31-20 41st St
- 43-12 30th Ave
- 43-14 30th Ave
- 44-14 Newtown Rd Unit 3C
- 44-14 Newtown Rd Unit 1O
- 44-14 Newtown Rd Unit 5N
- 44-22 Newtown Rd
- 31-61 43rd St
- 30-71 37th St
- 3702 31st Ave
- 3080 47th St Unit 3A
- 3094 47th St
- 3145 37th St Unit 3
- 3218 42nd St
- 47-05 Newtown Rd
- 32-29 44th St
- 3005 48th St
- 32-17 46th St
- 4811 30th Ave
- 3084 42nd St
- 30-80 42nd St
- 30-80 42nd St Unit A
- 30-80 42nd St Unit 2
- 30-80 42nd St Unit 1
- 30-80 42nd St Unit 2A
- 30-80 42nd St Unit 1A
- 30-80 42nd St Unit 1F
- 30-80 42nd St Unit 2F
- 3078 42nd St
- 3086 42nd St
- 30-86 42nd St
- 41-28 Newtown Rd
- 4128 Newtown Rd
- 3088 42nd St
- 30-88 42nd St
- 30-77 41st St Unit 1
- 30-77 41st St Unit 2
- 30 41 St
- 30-77 41st St